Axes and data
Number lines, grids, axis labels, c2p coordinate mapping, area and Riemann rectangles, plus bar charts, matrices and tables.
This page lists 12 examples. The code is imported from corpus/examples/graph/; the screenshots are end states rendered on real machines.
Number line with numbers
One number line; ticks and tick numbers agree and the spacing is even.
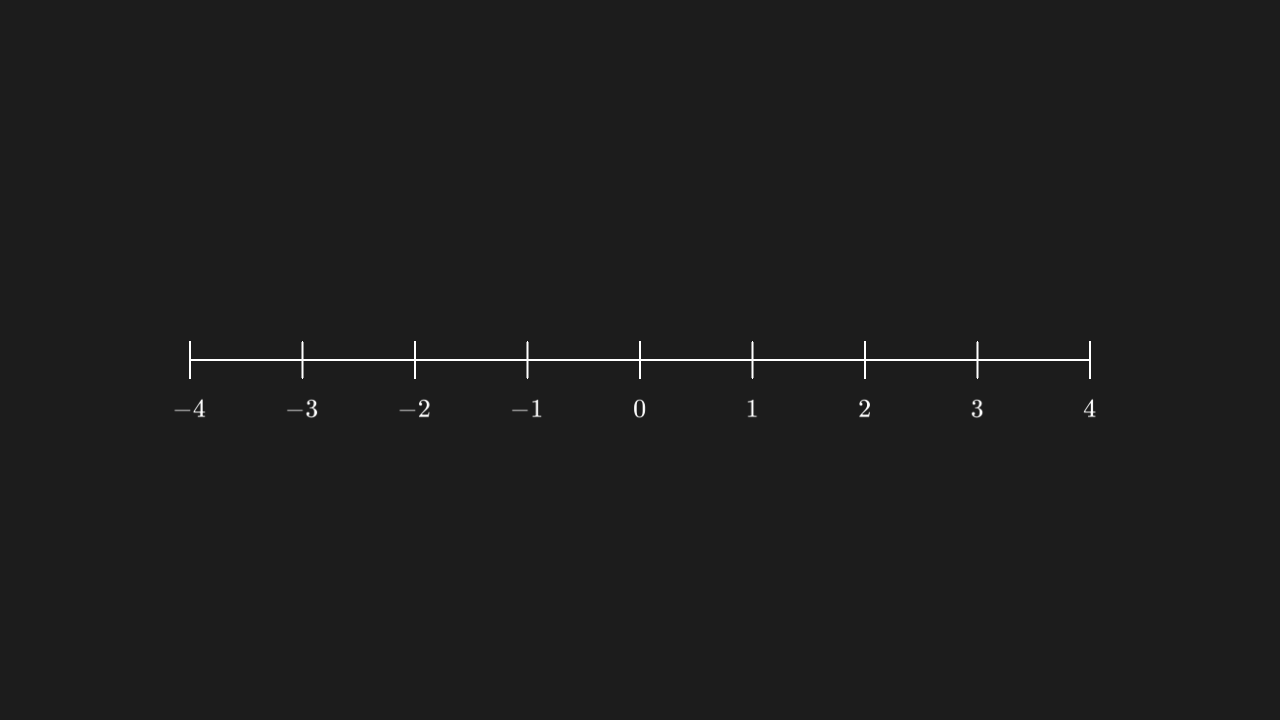
"""数轴 + 数字

@expect 一条数轴,刻度与刻度数字对得上、间距均匀。"""

from manim import *


class NumberLineScene(Scene):
    def construct(self):
        line = NumberLine(x_range=[-4, 4, 1], include_numbers=True)
        self.play(Create(line))
        self.wait(0.3)
Plane grid
A plane grid with both directions of lines complete and evenly spaced.
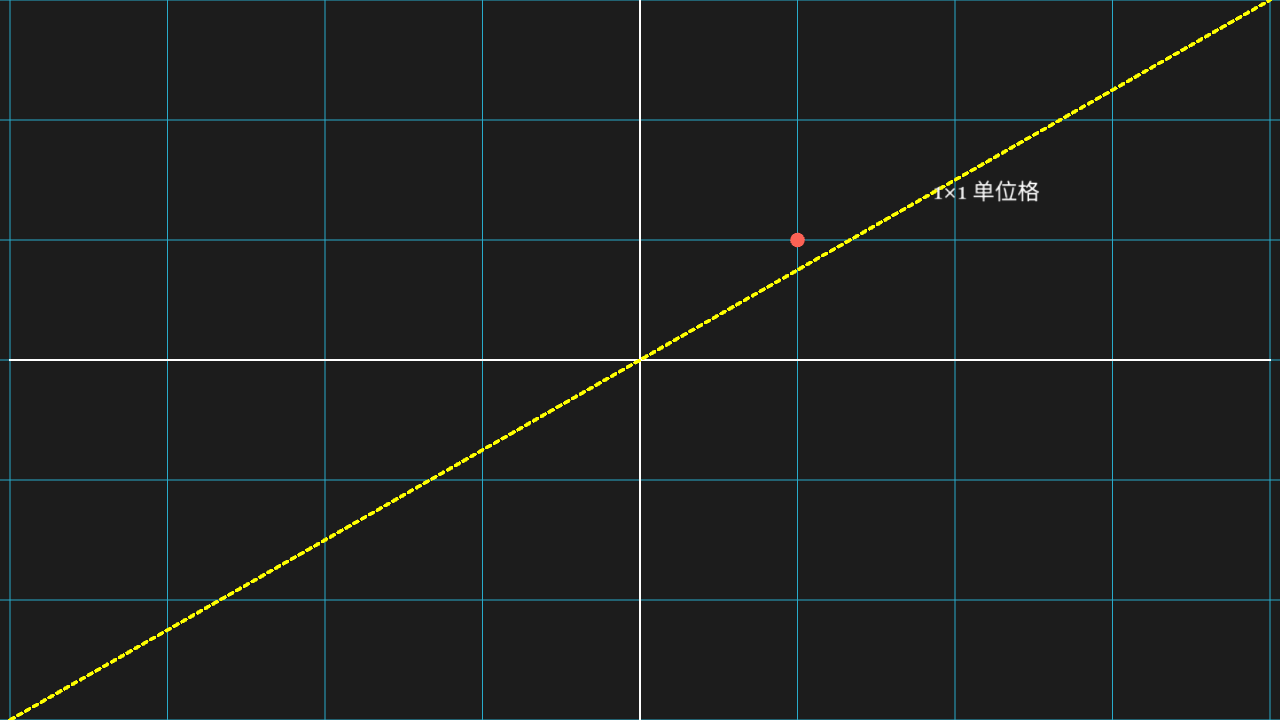
"""平面网格

@expect 平面网格两个方向的线都齐整,间距一致。"""

from manim import *


class NumberPlaneScene(Scene):
    def construct(self):
        plane = NumberPlane(x_range=[-4, 4, 1], y_range=[-3, 3, 1])
        self.play(Create(plane))
        # 自证等比:对角线若穿过每个网格交点,则横向/纵向格距相等
        diagonal = DashedLine(start=plane.c2p(-4, -3), end=plane.c2p(4, 3), color=YELLOW)
        unit_dot = Dot(point=plane.c2p(1, 1), color=RED)
        label = Text("1×1 单位格", font_size=24).move_to(plane.c2p(2.2, 1.4))
        self.play(Create(diagonal), FadeIn(unit_dot), FadeIn(label))
        self.wait(0.3)
Axes with axis labels
Axes with arrow tips and x / y labels; the labels sit at the axis ends.
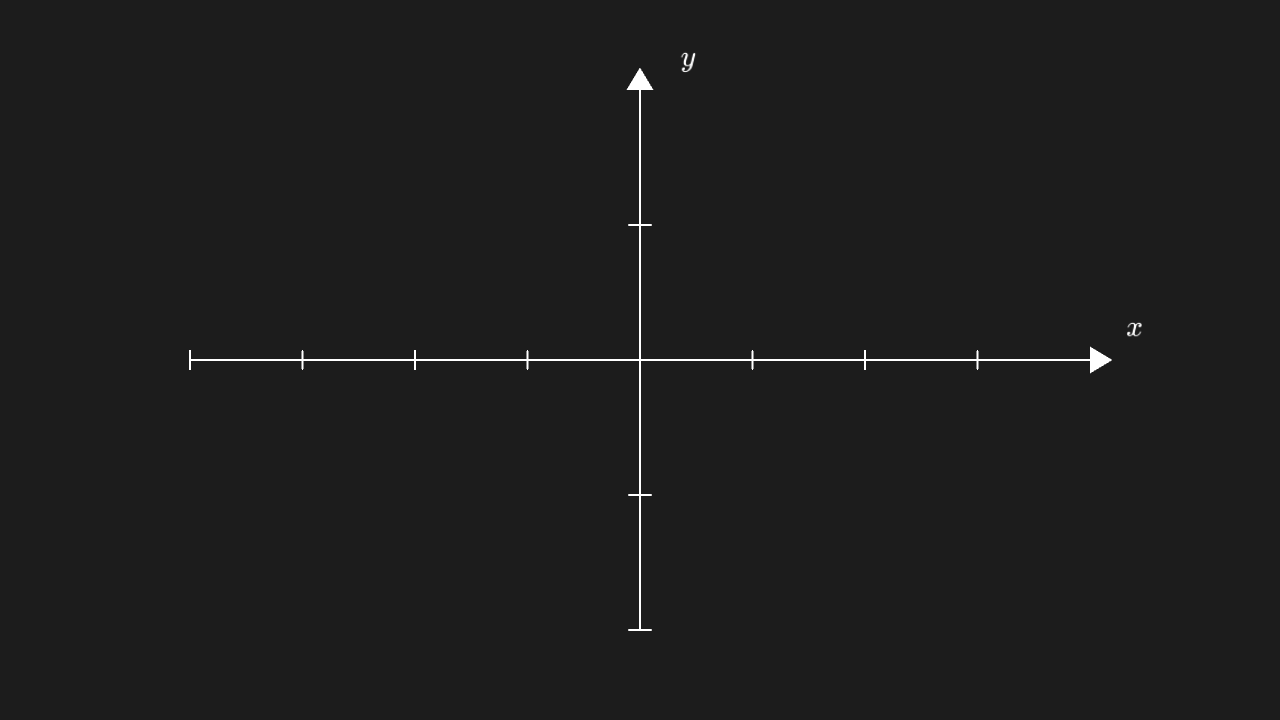
"""坐标轴 + 轴标签

@expect 坐标轴带箭头与 x / y 轴标签,标签贴在轴端。"""

from manim import *


class AxesLabelsScene(Scene):
    def construct(self):
        # 对称范围让原点居中,不缩在角落
        ax = Axes(x_range=[-4, 4, 1], y_range=[-2, 2, 1])
        labels = ax.get_axis_labels(x_label="x", y_label="y")
        self.play(Create(ax))
        self.play(Write(labels))
        self.wait(0.3)
Label on a curve
A label hugs its curve without leaving the frame or covering the line.
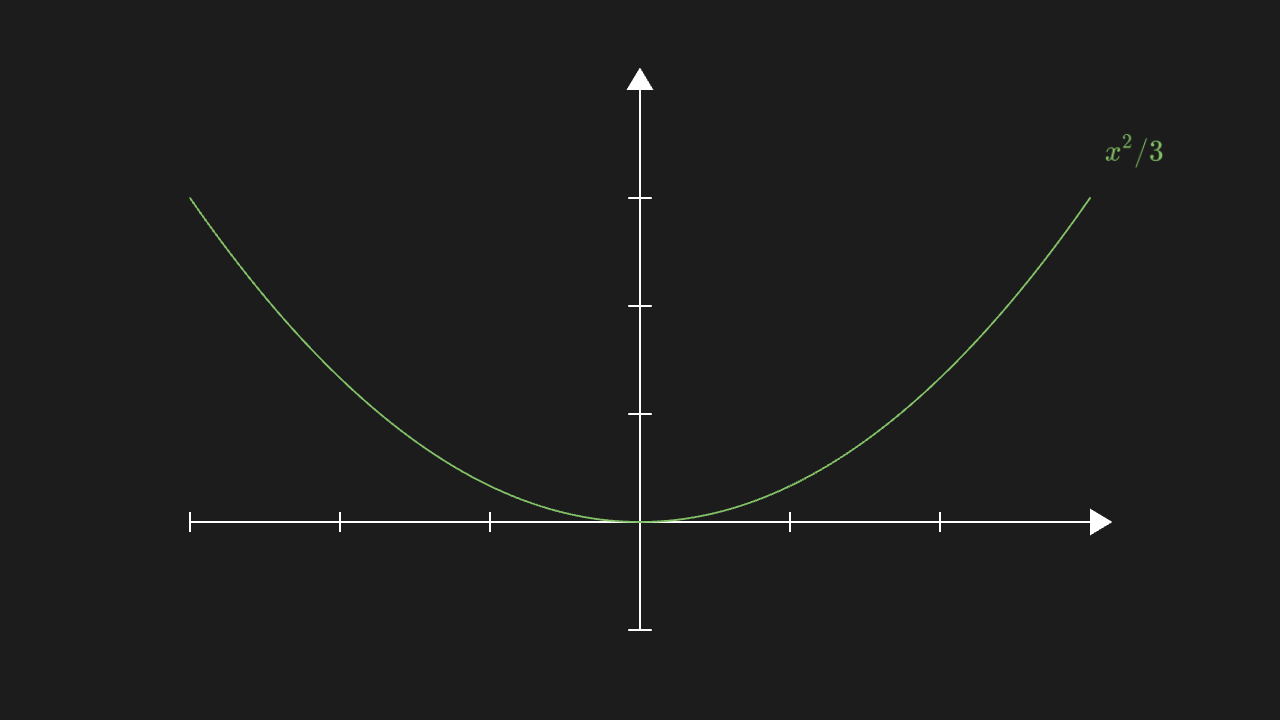
"""曲线加标签

@expect 曲线旁边贴着它的标签,不出画、不压线。"""

from manim import *


class GraphLabelScene(Scene):
    def construct(self):
        ax = Axes(x_range=[-3, 3, 1], y_range=[-1, 4, 1])
        graph = ax.plot(lambda x: x * x / 3, color=GREEN)
        label = ax.get_graph_label(graph, "x^2/3")
        self.play(Create(ax), Create(graph))
        self.play(Write(label))
        self.wait(0.3)
c2p maps coordinates to canvas positions
The marker lands exactly at the position c2p computes; the printed numbers match the picture.
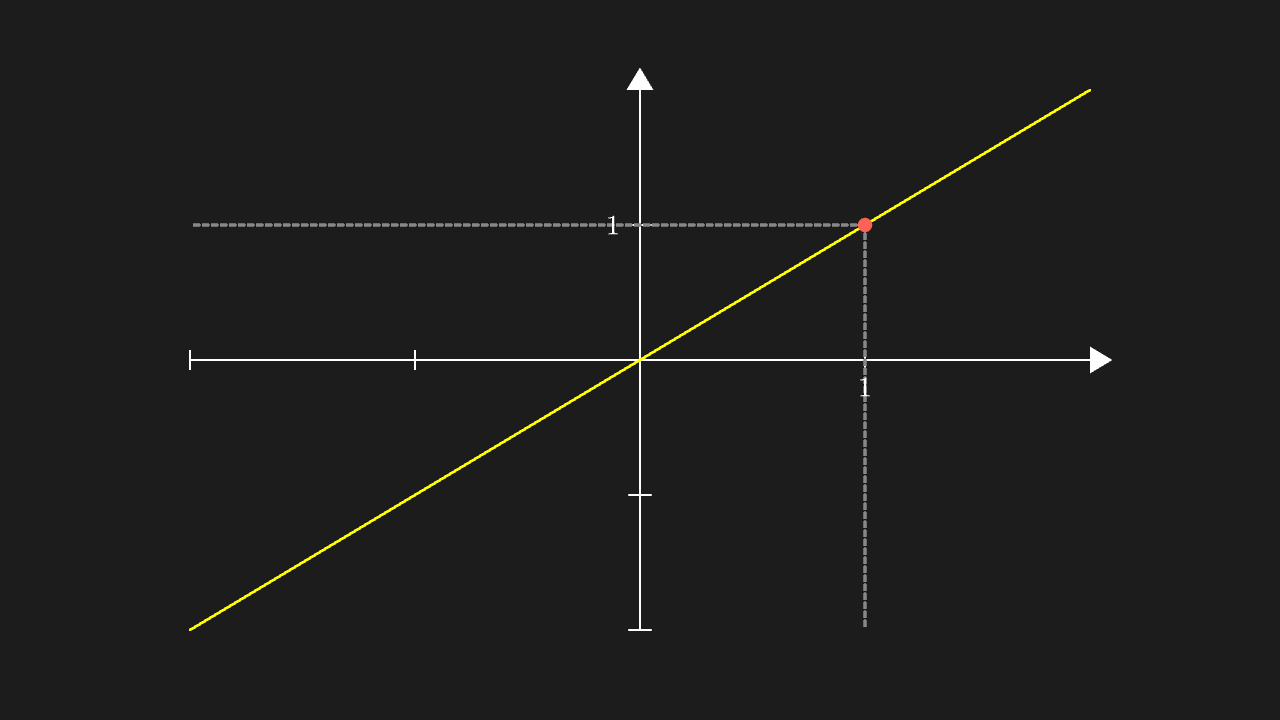
"""c2p 把坐标换算成画布位置

@expect 标记点精确落在 c2p 换算出的坐标位置上(print 的数值与画面一致)。
@note c2p / get_center 返回的是数值数组,适配层必须换成向量,否则 + 会变成列表拼接
"""

from manim import *


class C2pScene(Scene):
    def construct(self):
        ax = Axes(x_range=[-2, 2, 1], y_range=[-2, 2, 1], include_numbers=True)
        line = Line(start=ax.c2p(-2, -2), end=ax.c2p(2, 2), color=YELLOW)
        dot = Dot(point=ax.c2p(1, 1), color=RED)
        # 自证落点:从点向两轴引虚线,MathTex("1") 标出 x=1 / y=1 的位置
        vx = DashedLine(start=ax.c2p(1, 1), end=ax.c2p(1, -2), color=GREY)
        hy = DashedLine(start=ax.c2p(1, 1), end=ax.c2p(-2, 1), color=GREY)
        lx = MathTex("1", font_size=30).move_to([ax.c2p(1, 0)[0], ax.c2p(1, 0)[1] - 0.3, 0])
        ly = MathTex("1", font_size=30).move_to([ax.c2p(0, 1)[0] - 0.3, ax.c2p(0, 1)[1], 0])
        self.play(Create(ax), Create(line), FadeIn(dot), Create(vx), Create(hy), FadeIn(lx), FadeIn(ly))
        self.wait(0.3)
Area under a curve
A translucent fill between the curve and the x axis, bounded by the curve segment.
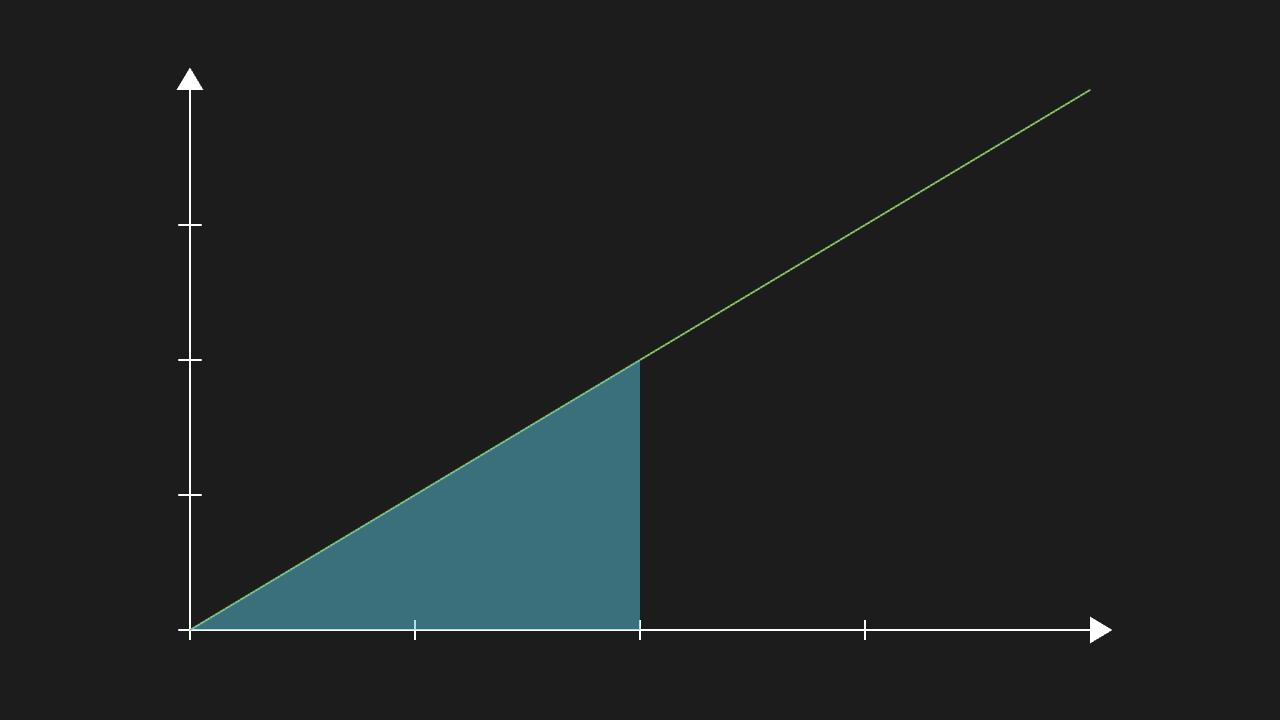
"""曲线下的面积

@expect 曲线与 x 轴之间一块半透明填充,边界就是曲线段。
@note manim-web 的 getArea 把 xRange 放在第二个位置参数,颜色那几项才进选项
"""

from manim import *


class AreaScene(Scene):
    def construct(self):
        ax = Axes(x_range=[0, 4, 1], y_range=[0, 4, 1])
        graph = ax.plot(lambda x: x, color=GREEN)
        area = ax.get_area(graph, x_range=[0, 2], color=BLUE, opacity=0.5)
        self.play(Create(ax), Create(graph), FadeIn(area))
        self.wait(0.3)
Riemann rectangles
A row of rectangles along the underside of the curve, heights following the sampled function values.
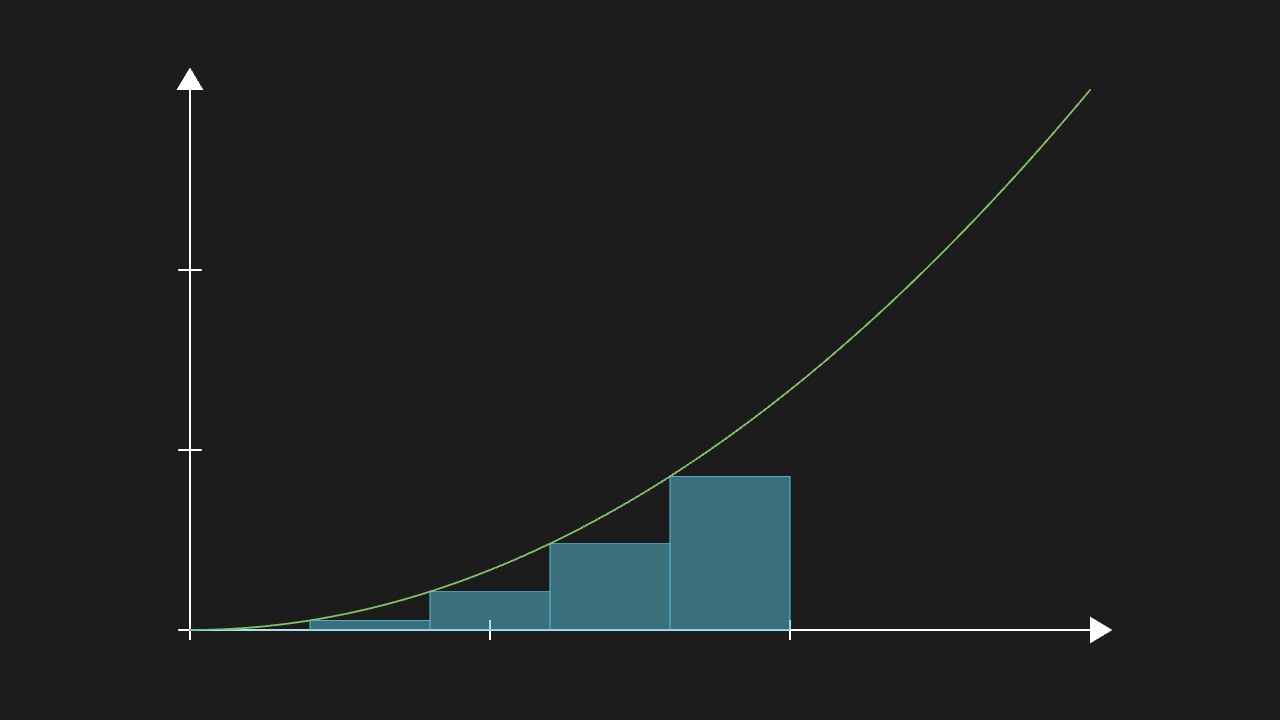
"""黎曼矩形

@expect 一排矩形贴着曲线下沿排开,高度按取样点的函数值。"""

from manim import *


class RiemannScene(Scene):
    def construct(self):
        ax = Axes(x_range=[0, 3, 1], y_range=[0, 3, 1])
        graph = ax.plot(lambda x: x * x / 3, color=GREEN)
        rects = ax.get_riemann_rectangles(graph, x_range=[0, 2], dx=0.4)
        self.play(Create(ax), Create(graph))
        self.play(FadeIn(rects))
        self.wait(0.3)
Bar chart
Three bars in red / blue / green with heights matching the data and even spacing; the title sits above without covering the chart.
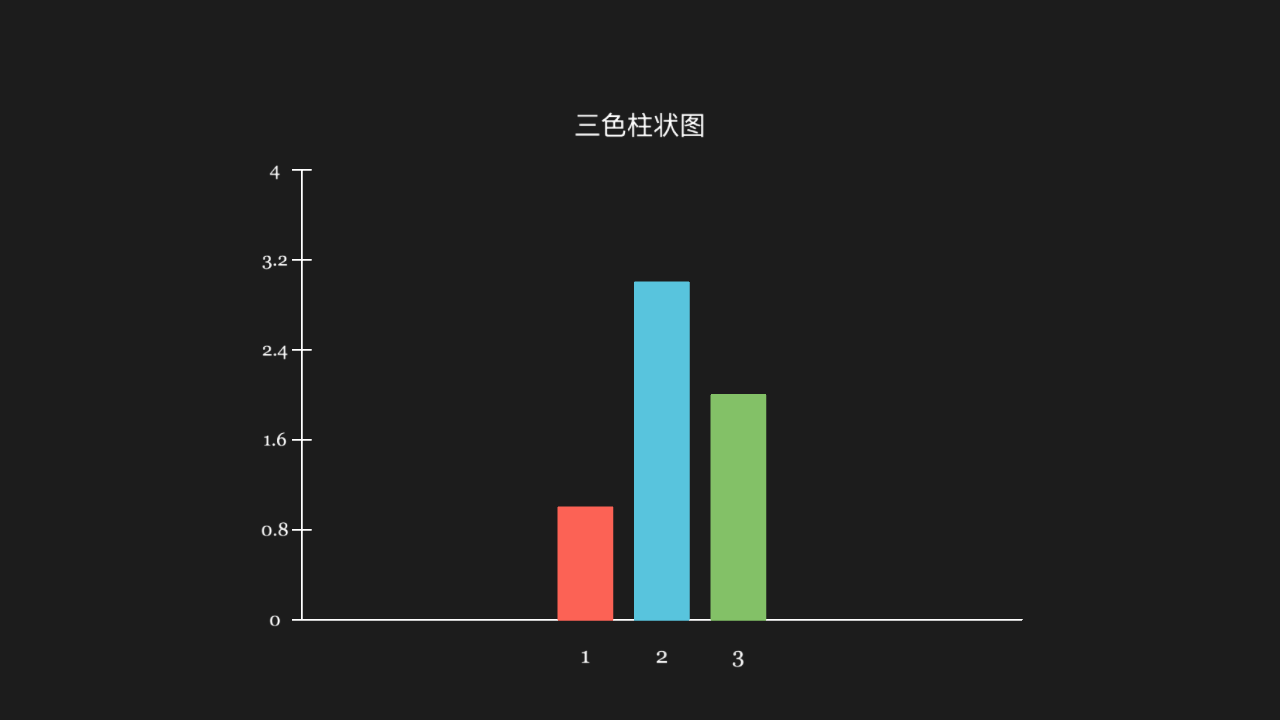
"""柱状图

@expect 三根柱子红 / 蓝 / 绿三色、高低与数据一致、间距均匀,标题在图上方不压图。"""

from manim import *


class BarChartScene(Scene):
    def construct(self):
        chart = BarChart(values=[1, 3, 2], bar_colors=[RED, BLUE, GREEN])
        chart.move_to([0, -0.6, 0])
        # 适配层 bug:bar_colors 不生效,且 set_fill 会连描边一起染——
        # 先逐根 set_fill,再单独 set_stroke 把描边改回同色。
        # 适配层没有 chart.bars:三根柱是 chart 的第 3 个子物体的 3 个孩子
        bars = chart[2]
        for bar, color in zip(bars, [RED, BLUE, GREEN]):
            bar.set_fill(color, opacity=1.0)
            bar.set_stroke(color=color)
        title = Text("三色柱状图", font_size=28, color=WHITE)
        title.move_to([0, 2.6, 0])
        self.play(Create(chart), Write(title))
        self.wait(0.3)
Matrix
A matrix laid out by rows and columns; the entries match the input.
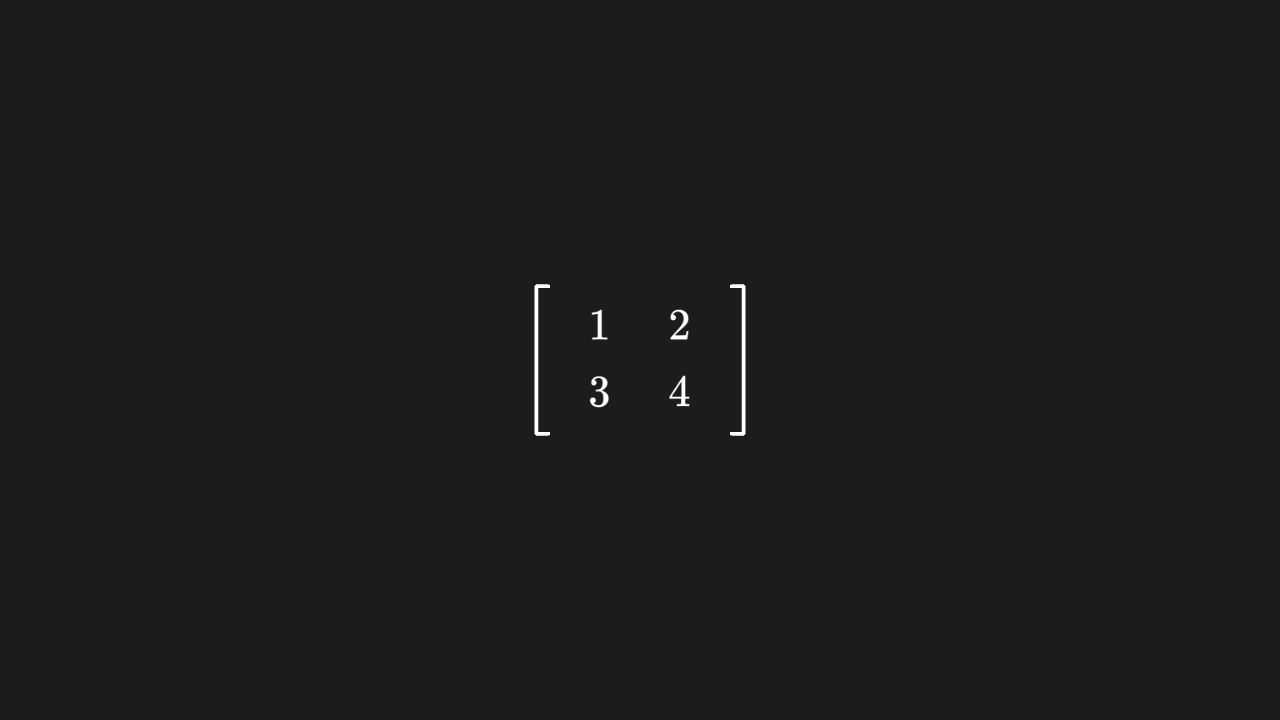
"""矩阵

@expect 矩阵按行列排布,元素与传入内容一致。
@note CE 的 Matrix(*rows) 是位置参数;manim-web 的构造器首参也是数据
"""

from manim import *


class MatrixScene(Scene):
    def construct(self):
        m = Matrix([[1, 2], [3, 4]])
        self.play(Write(m))
        self.wait(0.3)
Table with a header
A table with a header row; rows and columns aligned and all grid lines present.
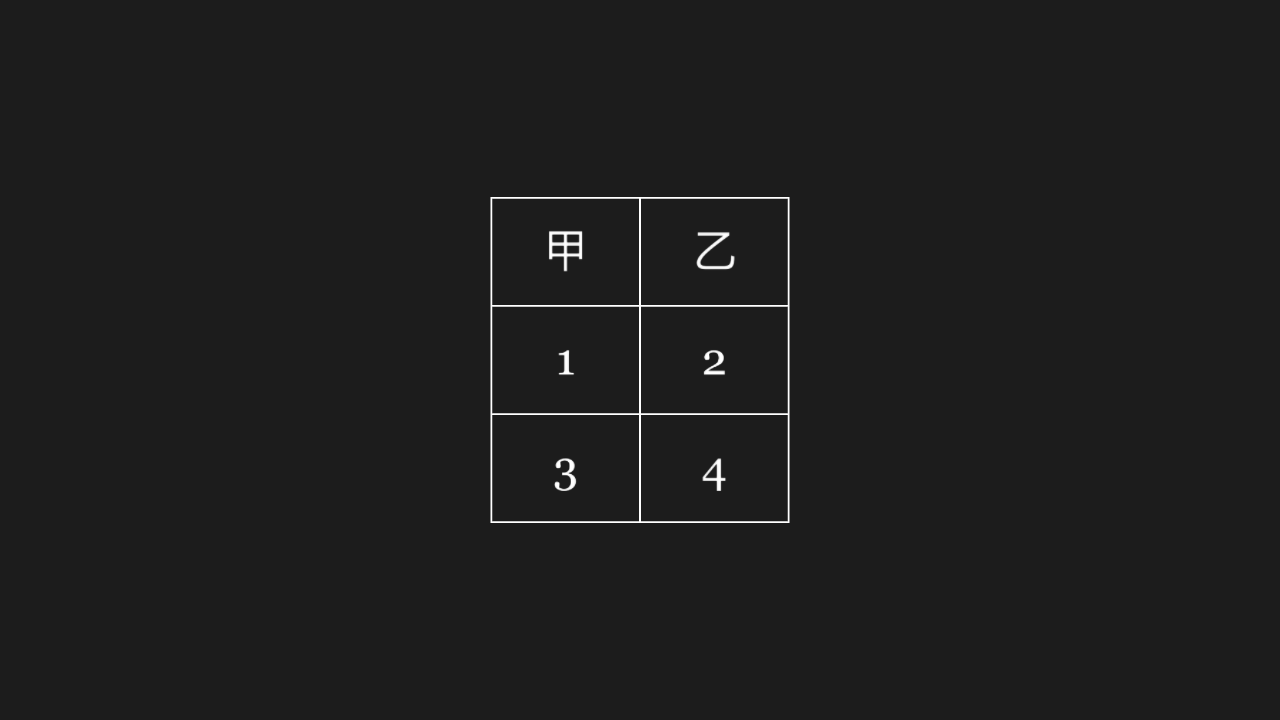
"""表格 + 表头

@expect 表格带表头行,行列对齐、格线齐全。
@note CE 的表首参叫 table,manim-web 的键叫 data;单元格要物体(manim-web 不换算数字)
"""

from manim import *


class TableScene(Scene):
    def construct(self):
        grid = Table([[Text("1"), Text("2")], [Text("3"), Text("4")]], col_labels=[Text("甲"), Text("乙")])
        self.play(FadeIn(grid))
        self.wait(0.3)
IntegerTable (numbers written directly)
Integers fill the cells directly (no LaTeX number formatting); the contents match.
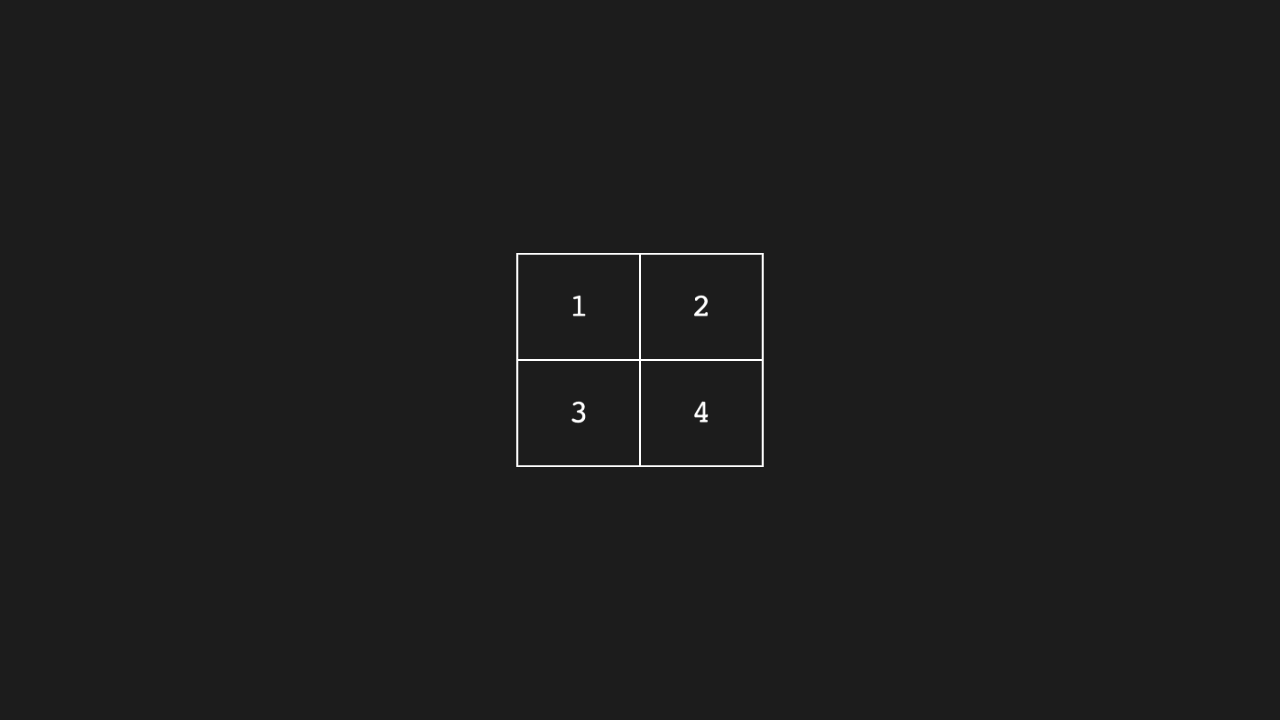
"""整数表(直接写数字)

@expect 整数直接填进格子(不经过 LaTeX 数字格式化),内容一致。
@note 纯数字的表走 IntegerTable / DecimalTable——它们才收原始数字
"""

from manim import *


class IntegerTableScene(Scene):
    def construct(self):
        grid = IntegerTable([[1, 2], [3, 4]])
        self.play(FadeIn(grid))
        self.wait(0.3)
LaTeX table
The table content is typeset as LaTeX (math fonts), not plain text fonts.
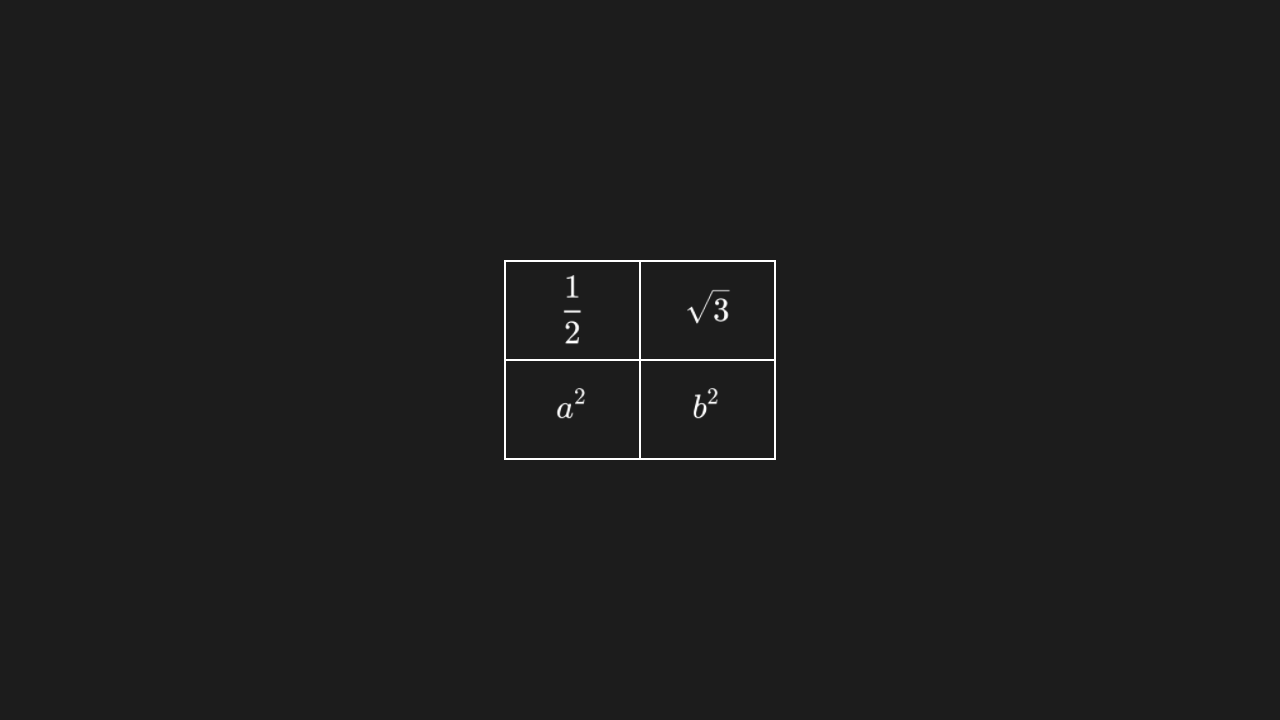
"""LaTeX 表

@expect 表格内容按 LaTeX 排版(公式字体),不是普通文本字体。
@note MathTable 收 LaTeX 字符串,manim-web 自己排成公式
"""

from manim import *


class MathTableScene(Scene):
    def construct(self):
        grid = MathTable([[r"\frac{1}{2}", r"\sqrt{3}"], [r"a^2", r"b^2"]])
        self.play(FadeIn(grid))
        self.wait(0.3)