坐标系与数据
数轴、网格、坐标轴标签、c2p 坐标换算、曲线面积与黎曼矩形,以及柱状图、矩阵与表格。
本页 12 条示例。代码引自 corpus/examples/graph/,截图为真机渲染的终态。
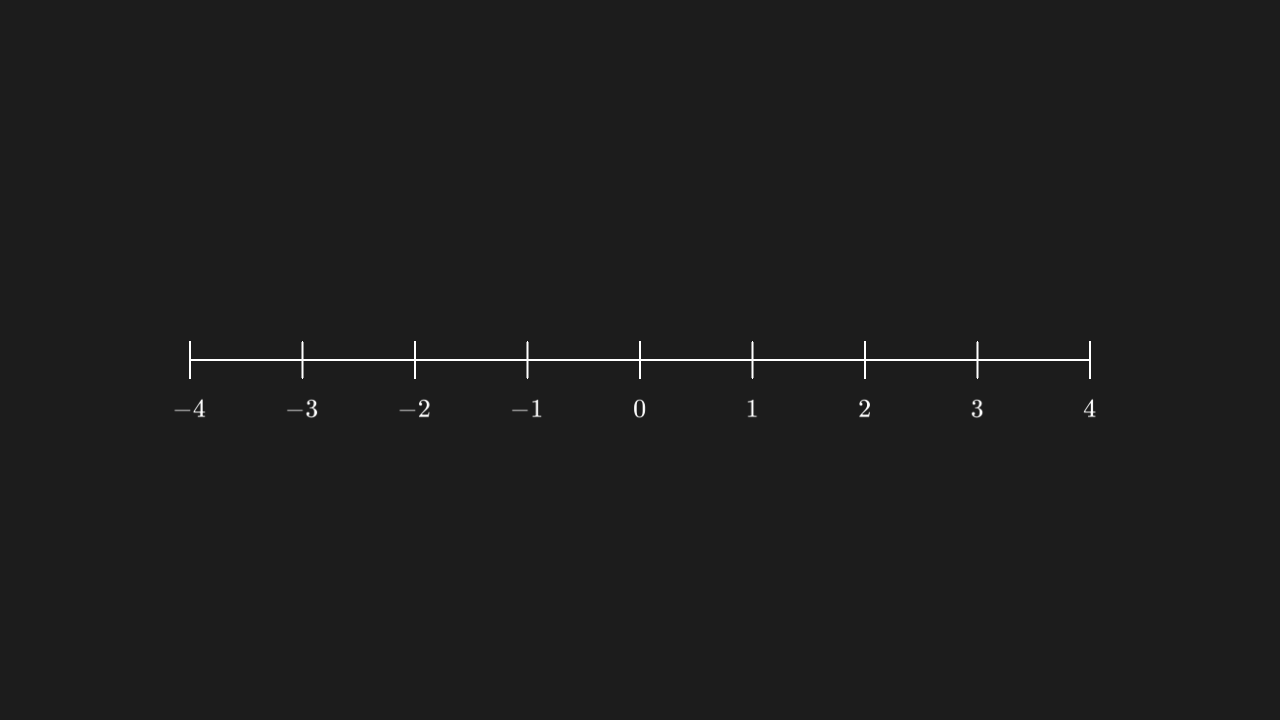
数轴 + 数字
一条数轴,刻度与刻度数字对得上、间距均匀。
py
"""数轴 + 数字

@expect 一条数轴,刻度与刻度数字对得上、间距均匀。"""

from manim import *


class NumberLineScene(Scene):
    def construct(self):
        line = NumberLine(x_range=[-4, 4, 1], include_numbers=True)
        self.play(Create(line))
        self.wait(0.3)
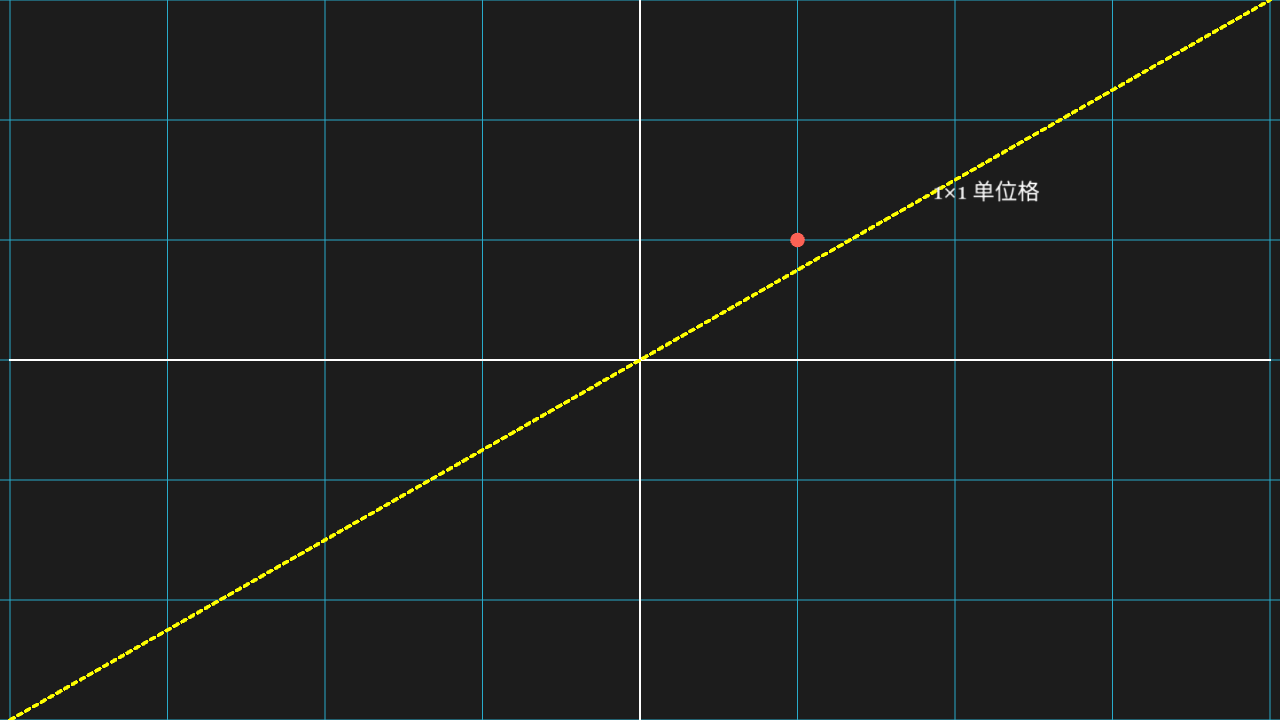
平面网格
平面网格两个方向的线都齐整,间距一致。
py
"""平面网格

@expect 平面网格两个方向的线都齐整,间距一致。"""

from manim import *


class NumberPlaneScene(Scene):
    def construct(self):
        plane = NumberPlane(x_range=[-4, 4, 1], y_range=[-3, 3, 1])
        self.play(Create(plane))
        # 自证等比:对角线若穿过每个网格交点,则横向/纵向格距相等
        diagonal = DashedLine(start=plane.c2p(-4, -3), end=plane.c2p(4, 3), color=YELLOW)
        unit_dot = Dot(point=plane.c2p(1, 1), color=RED)
        label = Text("1×1 单位格", font_size=24).move_to(plane.c2p(2.2, 1.4))
        self.play(Create(diagonal), FadeIn(unit_dot), FadeIn(label))
        self.wait(0.3)
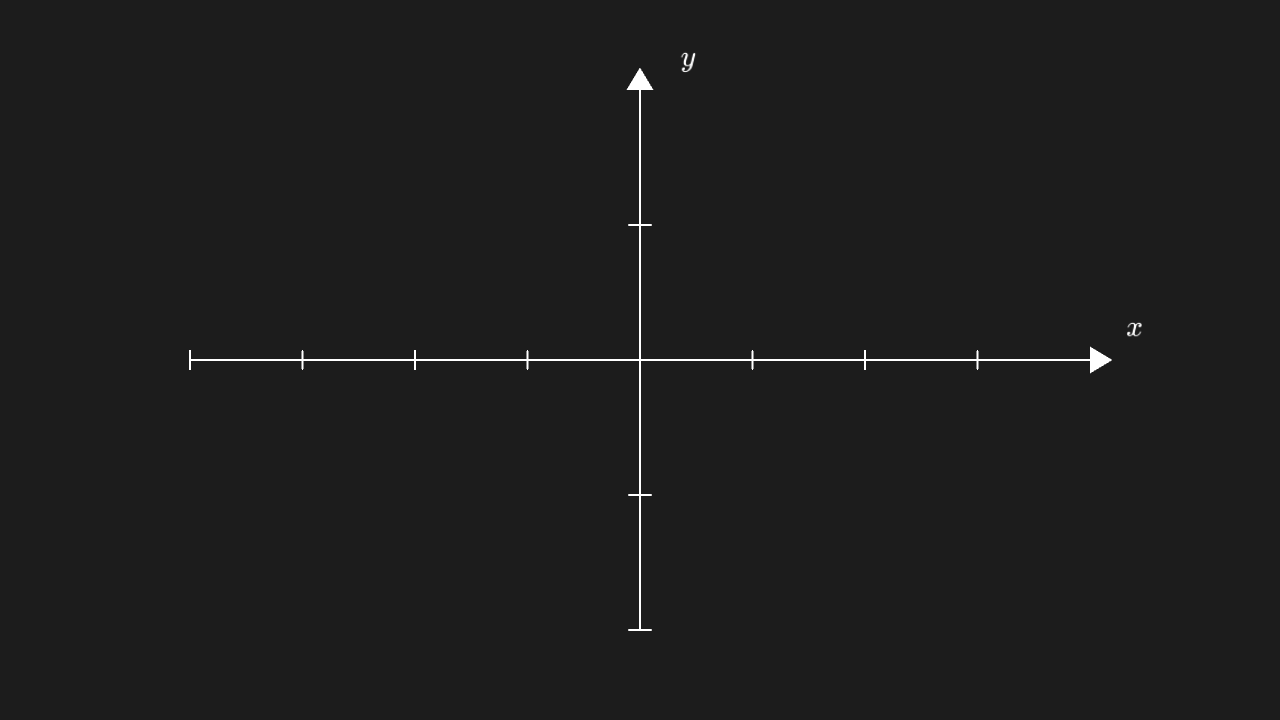
坐标轴 + 轴标签
坐标轴带箭头与 x / y 轴标签,标签贴在轴端。
py
"""坐标轴 + 轴标签

@expect 坐标轴带箭头与 x / y 轴标签,标签贴在轴端。"""

from manim import *


class AxesLabelsScene(Scene):
    def construct(self):
        # 对称范围让原点居中,不缩在角落
        ax = Axes(x_range=[-4, 4, 1], y_range=[-2, 2, 1])
        labels = ax.get_axis_labels(x_label="x", y_label="y")
        self.play(Create(ax))
        self.play(Write(labels))
        self.wait(0.3)
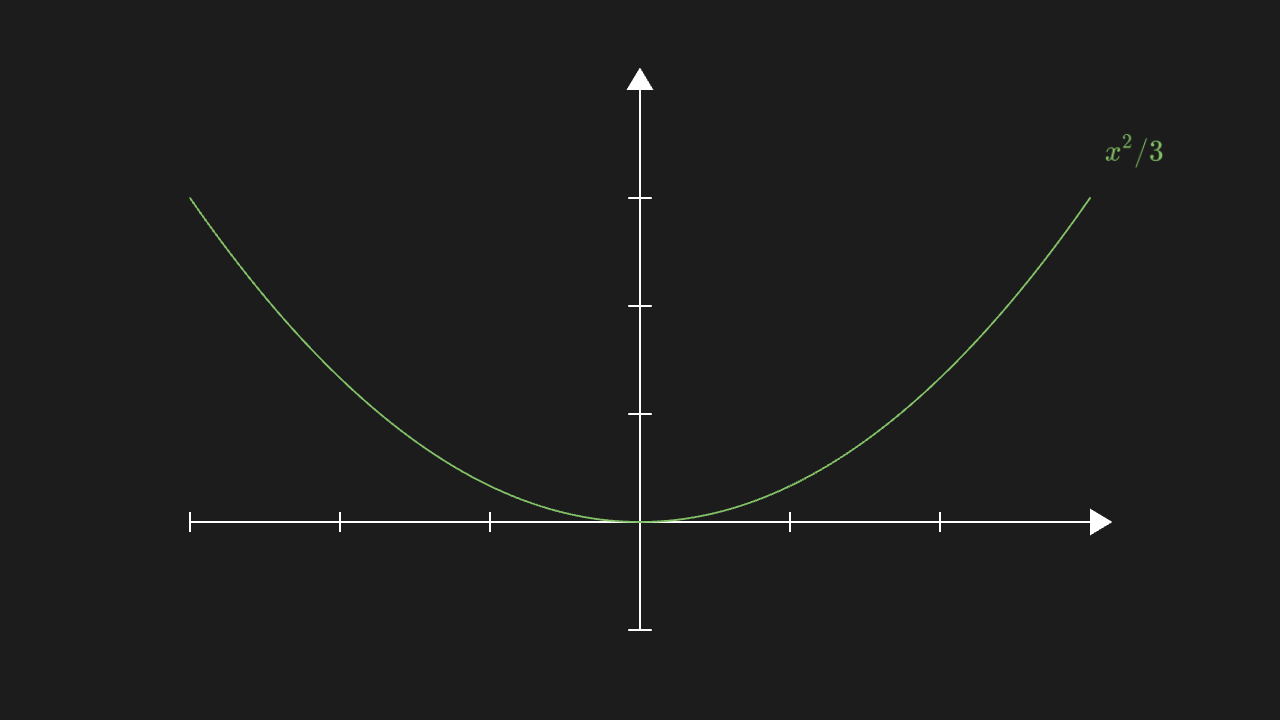
曲线加标签
曲线旁边贴着它的标签,不出画、不压线。
py
"""曲线加标签

@expect 曲线旁边贴着它的标签,不出画、不压线。"""

from manim import *


class GraphLabelScene(Scene):
    def construct(self):
        ax = Axes(x_range=[-3, 3, 1], y_range=[-1, 4, 1])
        graph = ax.plot(lambda x: x * x / 3, color=GREEN)
        label = ax.get_graph_label(graph, "x^2/3")
        self.play(Create(ax), Create(graph))
        self.play(Write(label))
        self.wait(0.3)
c2p 把坐标换算成画布位置
标记点精确落在 c2p 换算出的坐标位置上(print 的数值与画面一致)。
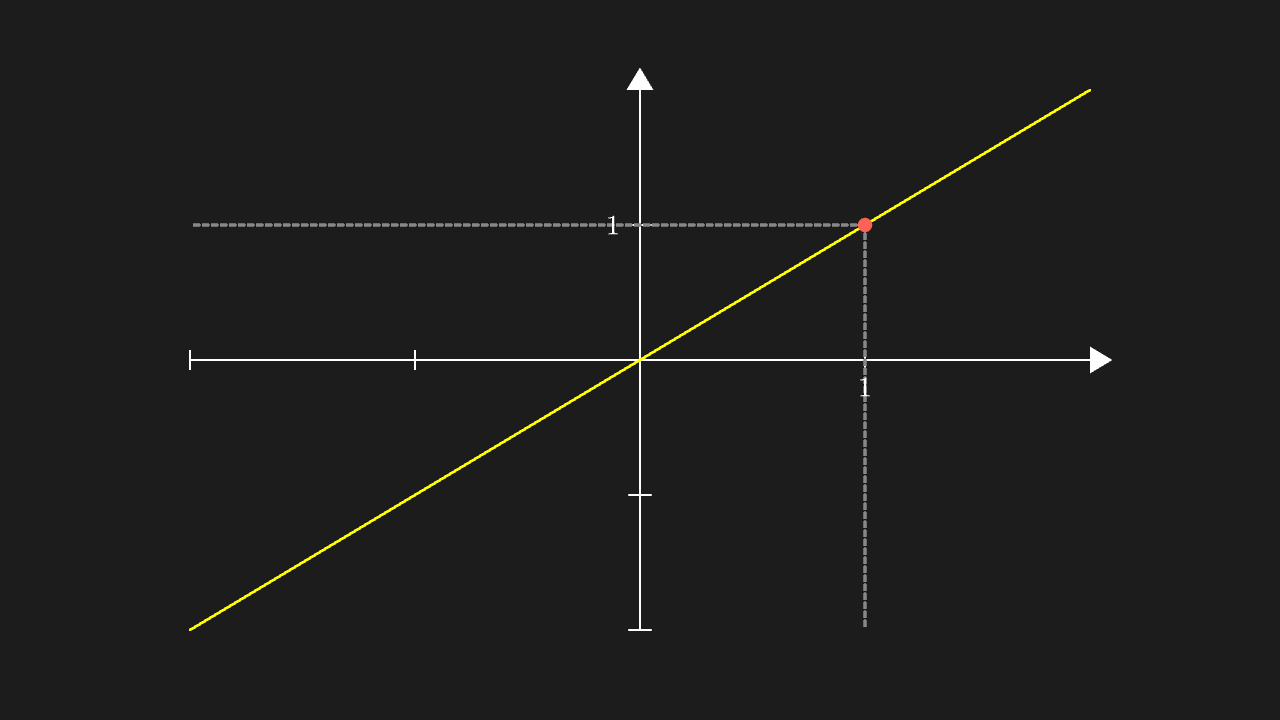
py
"""c2p 把坐标换算成画布位置

@expect 标记点精确落在 c2p 换算出的坐标位置上(print 的数值与画面一致)。
@note c2p / get_center 返回的是数值数组,适配层必须换成向量,否则 + 会变成列表拼接
"""

from manim import *


class C2pScene(Scene):
    def construct(self):
        ax = Axes(x_range=[-2, 2, 1], y_range=[-2, 2, 1], include_numbers=True)
        line = Line(start=ax.c2p(-2, -2), end=ax.c2p(2, 2), color=YELLOW)
        dot = Dot(point=ax.c2p(1, 1), color=RED)
        # 自证落点:从点向两轴引虚线,MathTex("1") 标出 x=1 / y=1 的位置
        vx = DashedLine(start=ax.c2p(1, 1), end=ax.c2p(1, -2), color=GREY)
        hy = DashedLine(start=ax.c2p(1, 1), end=ax.c2p(-2, 1), color=GREY)
        lx = MathTex("1", font_size=30).move_to([ax.c2p(1, 0)[0], ax.c2p(1, 0)[1] - 0.3, 0])
        ly = MathTex("1", font_size=30).move_to([ax.c2p(0, 1)[0] - 0.3, ax.c2p(0, 1)[1], 0])
        self.play(Create(ax), Create(line), FadeIn(dot), Create(vx), Create(hy), FadeIn(lx), FadeIn(ly))
        self.wait(0.3)
曲线下的面积
曲线与 x 轴之间一块半透明填充,边界就是曲线段。
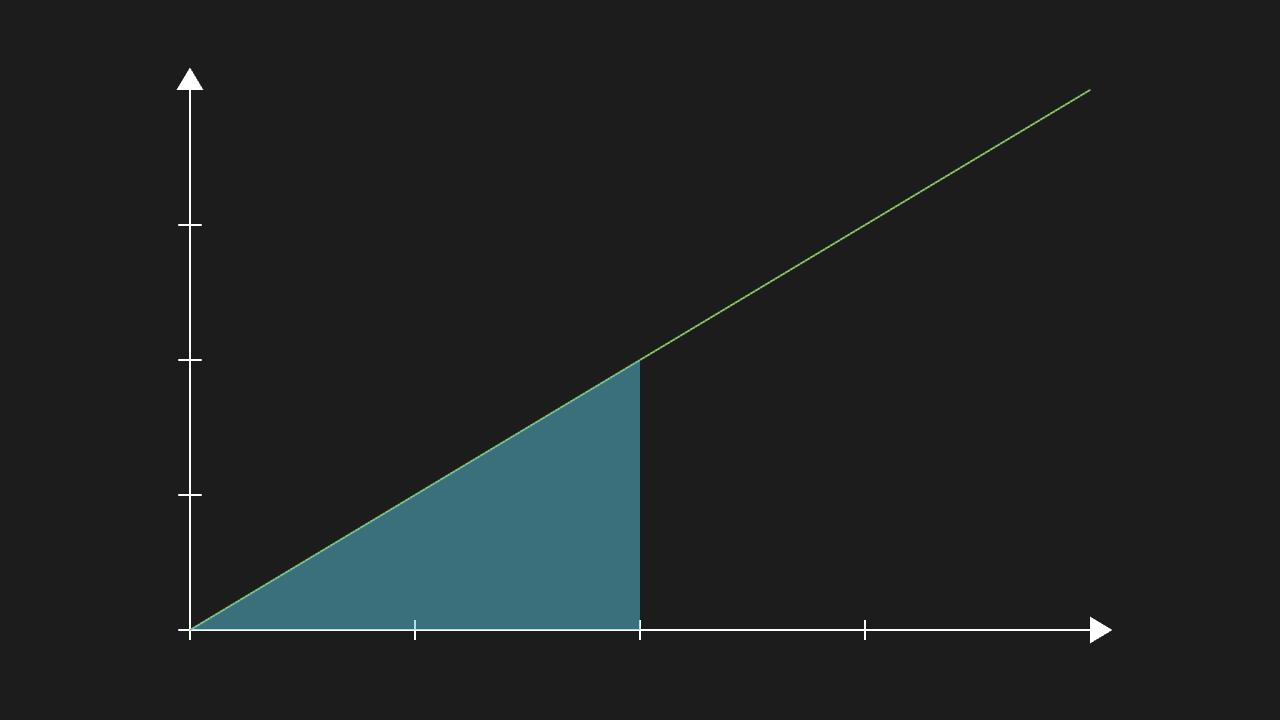
py
"""曲线下的面积

@expect 曲线与 x 轴之间一块半透明填充,边界就是曲线段。
@note manim-web 的 getArea 把 xRange 放在第二个位置参数,颜色那几项才进选项
"""

from manim import *


class AreaScene(Scene):
    def construct(self):
        ax = Axes(x_range=[0, 4, 1], y_range=[0, 4, 1])
        graph = ax.plot(lambda x: x, color=GREEN)
        area = ax.get_area(graph, x_range=[0, 2], color=BLUE, opacity=0.5)
        self.play(Create(ax), Create(graph), FadeIn(area))
        self.wait(0.3)
黎曼矩形
一排矩形贴着曲线下沿排开,高度按取样点的函数值。
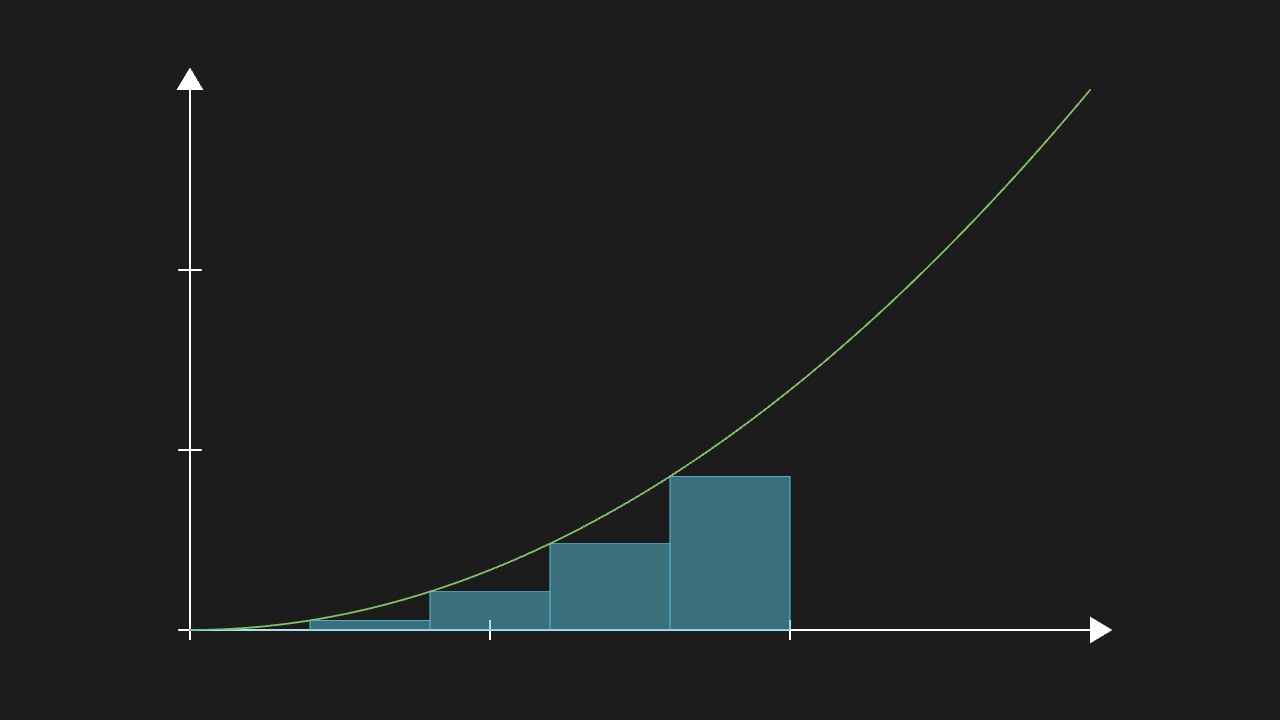
py
"""黎曼矩形

@expect 一排矩形贴着曲线下沿排开,高度按取样点的函数值。"""

from manim import *


class RiemannScene(Scene):
    def construct(self):
        ax = Axes(x_range=[0, 3, 1], y_range=[0, 3, 1])
        graph = ax.plot(lambda x: x * x / 3, color=GREEN)
        rects = ax.get_riemann_rectangles(graph, x_range=[0, 2], dx=0.4)
        self.play(Create(ax), Create(graph))
        self.play(FadeIn(rects))
        self.wait(0.3)
柱状图
三根柱子红 / 蓝 / 绿三色、高低与数据一致、间距均匀,标题在图上方不压图。
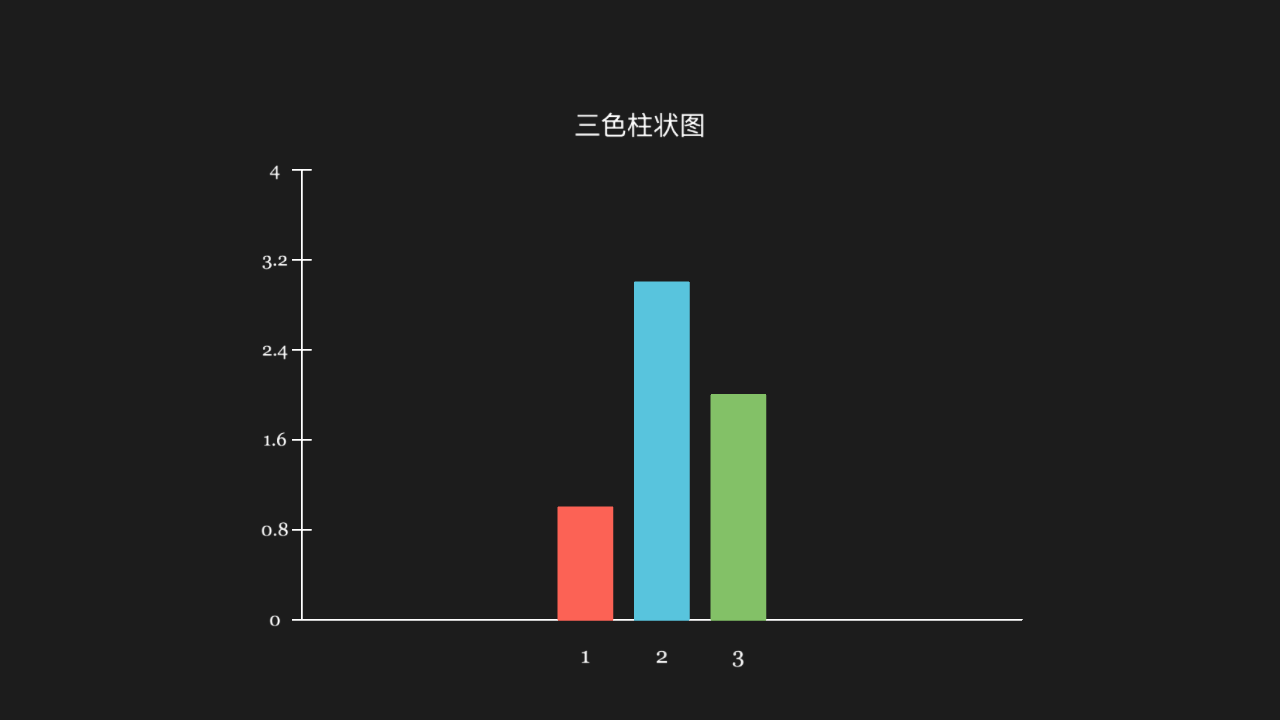
py
"""柱状图

@expect 三根柱子红 / 蓝 / 绿三色、高低与数据一致、间距均匀,标题在图上方不压图。"""

from manim import *


class BarChartScene(Scene):
    def construct(self):
        chart = BarChart(values=[1, 3, 2], bar_colors=[RED, BLUE, GREEN])
        chart.move_to([0, -0.6, 0])
        # 适配层 bug:bar_colors 不生效,且 set_fill 会连描边一起染——
        # 先逐根 set_fill,再单独 set_stroke 把描边改回同色。
        # 适配层没有 chart.bars:三根柱是 chart 的第 3 个子物体的 3 个孩子
        bars = chart[2]
        for bar, color in zip(bars, [RED, BLUE, GREEN]):
            bar.set_fill(color, opacity=1.0)
            bar.set_stroke(color=color)
        title = Text("三色柱状图", font_size=28, color=WHITE)
        title.move_to([0, 2.6, 0])
        self.play(Create(chart), Write(title))
        self.wait(0.3)
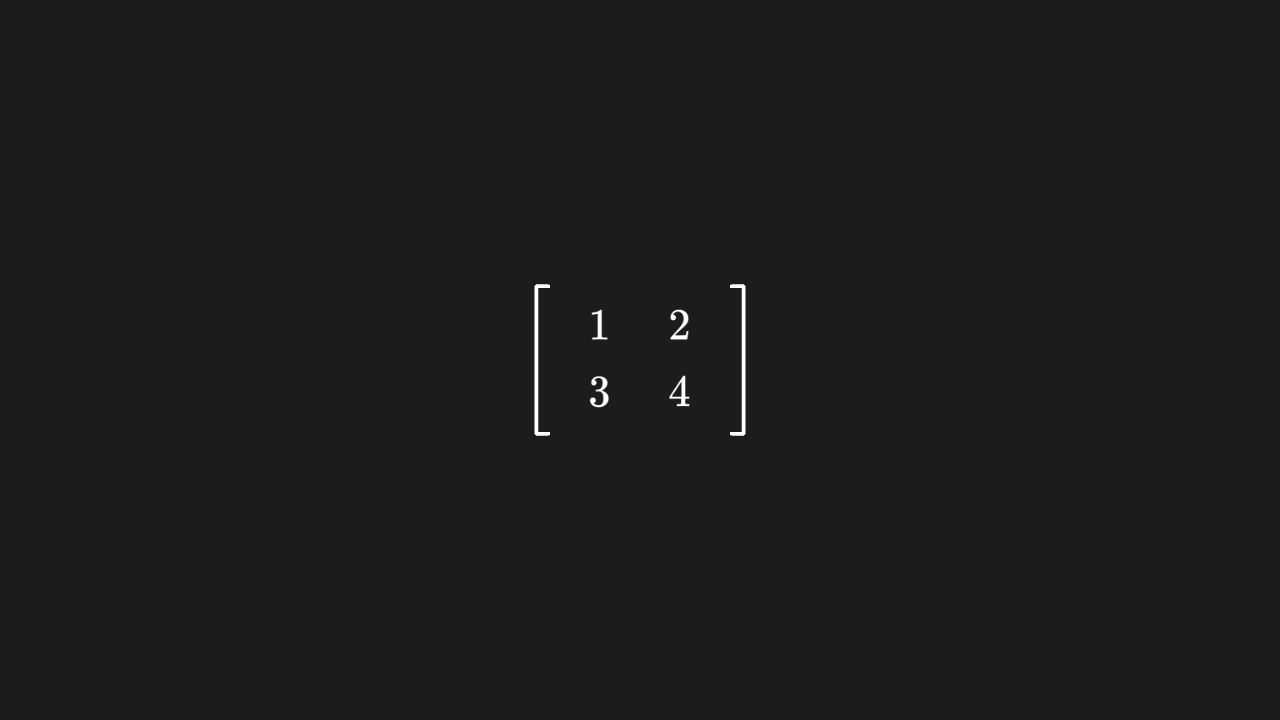
矩阵
矩阵按行列排布,元素与传入内容一致。
py
"""矩阵

@expect 矩阵按行列排布,元素与传入内容一致。
@note CE 的 Matrix(*rows) 是位置参数;manim-web 的构造器首参也是数据
"""

from manim import *


class MatrixScene(Scene):
    def construct(self):
        m = Matrix([[1, 2], [3, 4]])
        self.play(Write(m))
        self.wait(0.3)
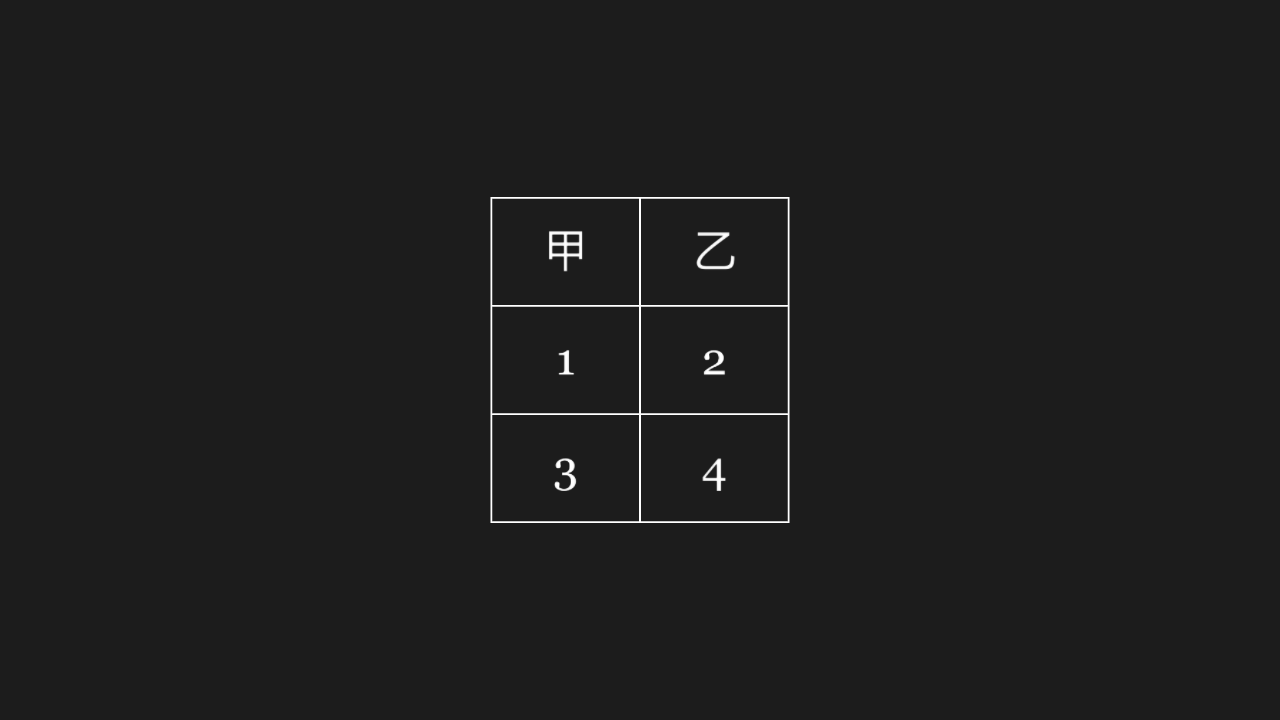
表格 + 表头
表格带表头行,行列对齐、格线齐全。
py
"""表格 + 表头

@expect 表格带表头行,行列对齐、格线齐全。
@note CE 的表首参叫 table,manim-web 的键叫 data;单元格要物体(manim-web 不换算数字)
"""

from manim import *


class TableScene(Scene):
    def construct(self):
        grid = Table([[Text("1"), Text("2")], [Text("3"), Text("4")]], col_labels=[Text("甲"), Text("乙")])
        self.play(FadeIn(grid))
        self.wait(0.3)
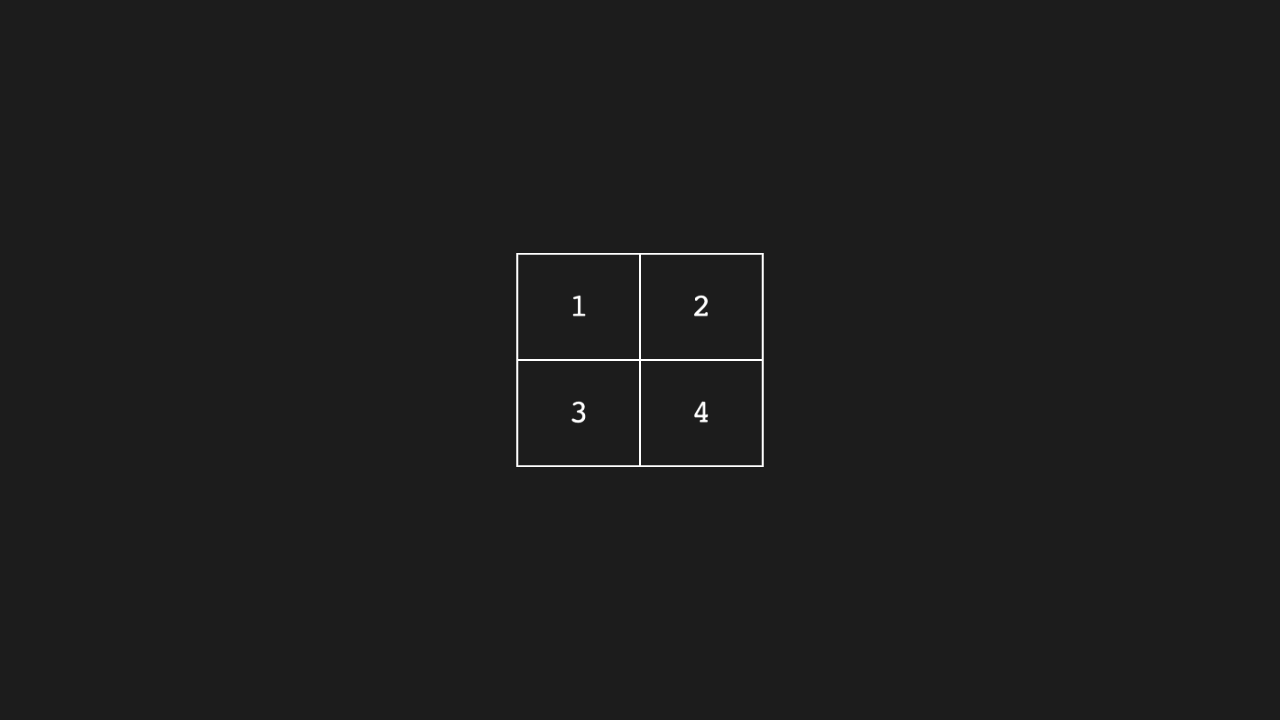
整数表(直接写数字)
整数直接填进格子(不经过 LaTeX 数字格式化),内容一致。
py
"""整数表(直接写数字)

@expect 整数直接填进格子(不经过 LaTeX 数字格式化),内容一致。
@note 纯数字的表走 IntegerTable / DecimalTable——它们才收原始数字
"""

from manim import *


class IntegerTableScene(Scene):
    def construct(self):
        grid = IntegerTable([[1, 2], [3, 4]])
        self.play(FadeIn(grid))
        self.wait(0.3)
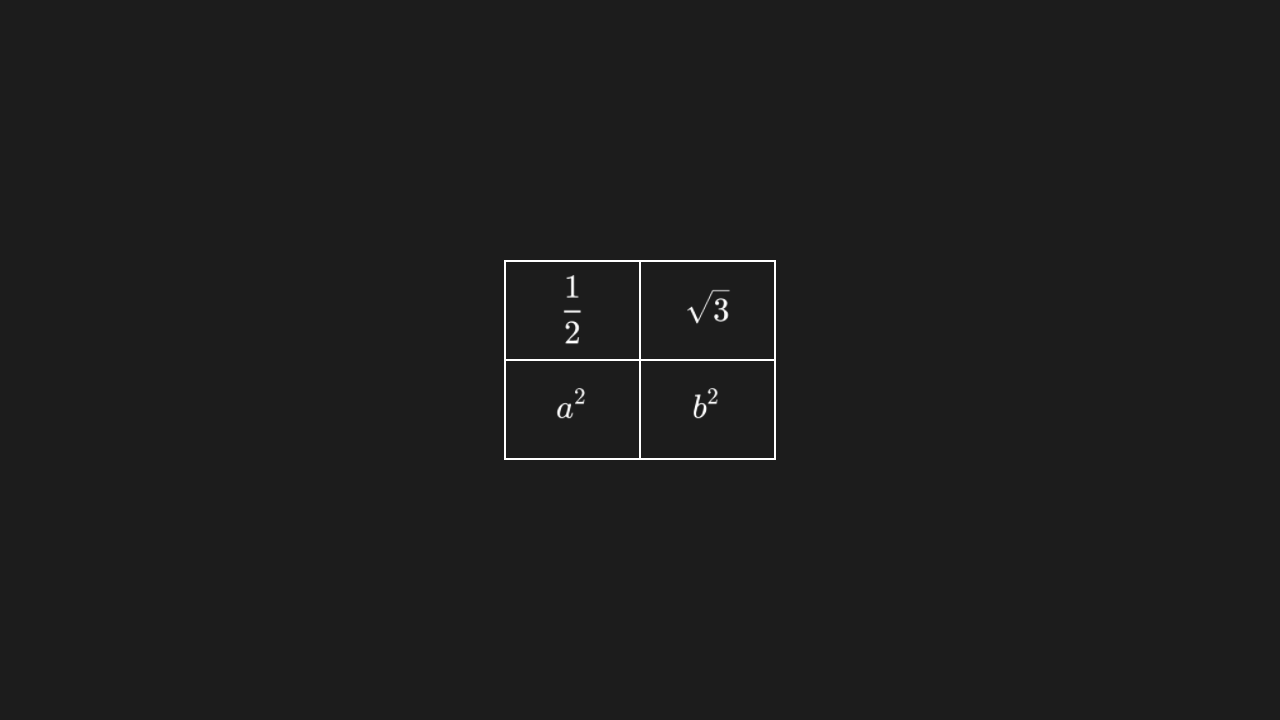
LaTeX 表
表格内容按 LaTeX 排版(公式字体),不是普通文本字体。
py
"""LaTeX 表

@expect 表格内容按 LaTeX 排版(公式字体),不是普通文本字体。
@note MathTable 收 LaTeX 字符串,manim-web 自己排成公式
"""

from manim import *


class MathTableScene(Scene):
    def construct(self):
        grid = MathTable([[r"\frac{1}{2}", r"\sqrt{3}"], [r"a^2", r"b^2"]])
        self.play(FadeIn(grid))
        self.wait(0.3)