讲解场景(模板)
通用讲解范式:单位圆、正弦波追踪、勾股、极坐标、割线趋近、黎曼和、线性变换与概率对照。
本页 13 条示例。代码引自 corpus/examples/lesson/,截图为真机渲染的终态。
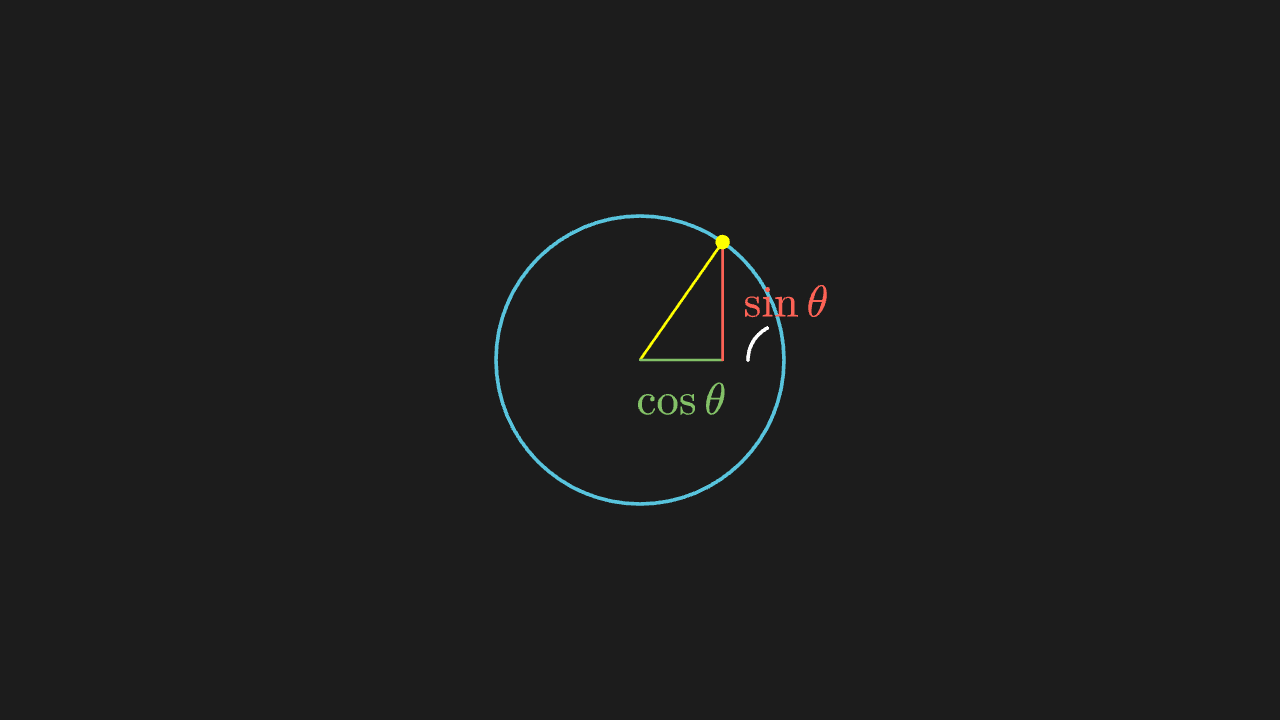
单位圆与三角函数线
单位圆上一点转动,正弦 / 余弦线随角度伸缩,长度与角度对得上。
"""单位圆与三角函数线

@expect 单位圆上一点转动,正弦 / 余弦线随角度伸缩,长度与角度对得上。
@template 要画「一个量随角度/参数变化」的静态定义图(圆上取点 + 投影线 + 对应公式标注)时照它抄。
@note 讲解模板:角度 → 圆上一点 → sin / cos 两条投影线。讲定义的静态图
"""

from manim import *
import numpy as np


class UnitCircleScene(Scene):
    def construct(self):
        radius = 1.6
        angle = 55 * DEGREES
        point = np.array([radius * np.cos(angle), radius * np.sin(angle), 0])

        circle = Circle(radius=radius, color=BLUE)
        radius_line = Line(start=ORIGIN, end=point, color=YELLOW)
        cos_leg = Line(start=ORIGIN, end=[point[0], 0, 0], color=GREEN)
        sin_leg = Line(start=[point[0], 0, 0], end=point, color=RED)
        dot = Dot(point=point, radius=0.08, color=YELLOW)
        arc = Angle([[0, 0, 0], [radius, 0, 0], point], radius=0.4)
        label_cos = MathTex(r"\cos\theta", color=GREEN).next_to(cos_leg, DOWN)
        label_sin = MathTex(r"\sin\theta", color=RED).next_to(sin_leg, RIGHT)

        self.play(Create(circle))
        self.play(Create(radius_line), FadeIn(dot), Create(arc))
        self.play(Create(cos_leg), Write(label_cos))
        self.play(Create(sin_leg), Write(label_sin))
        self.wait(0.3)
从圆上一点画出正弦波
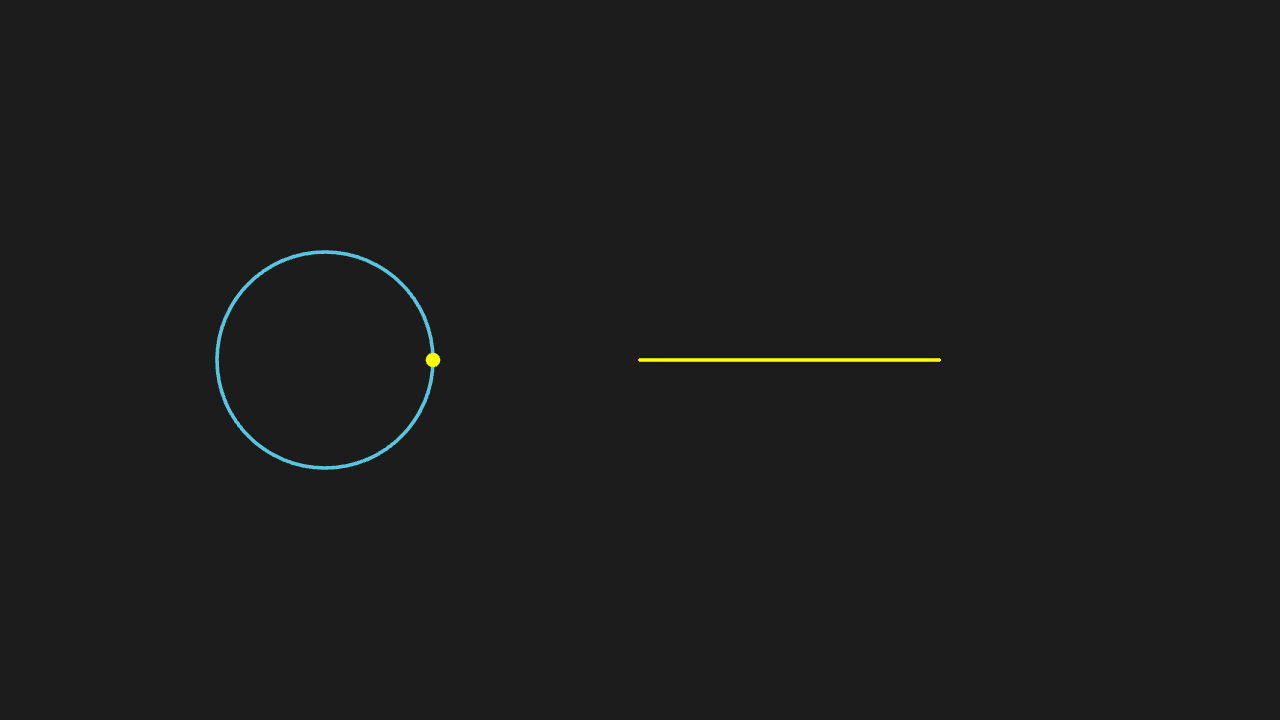
圆上的点一边转、波形一边向右展开,画出的正是正弦曲线(振幅 ±1.2 的完整正弦,真时序下观察;极速截图帧点过疏会让 TracedPath 轨迹塌成直线,属截图假象)。
"""从圆上一点画出正弦波

@expect 圆上的点一边转、波形一边向右展开,画出的正是正弦曲线(振幅 ±1.2 的完整正弦,真时序下观察;极速截图帧点过疏会让 TracedPath 轨迹塌成直线,属截图假象)。
@template 要让一个点/量被 ValueTracker 驱动、边动边扫出轨迹(TracedPath / updaters)时照它抄。
@note 讲解模板:ValueTracker 驱动圆上的点,TracedPath 把它的高度扫成波形;留存截图用 --realtime 真时序重截
"""

from manim import *
import numpy as np


class SineWaveScene(Scene):
    def construct(self):
        radius = 1.2
        circle = Circle(radius=radius, color=BLUE).shift(LEFT * 3.5)
        dot = Dot(radius=0.08, color=YELLOW)
        pen = Dot(radius=0.001)
        wave = TracedPath(pen, stroke_color=YELLOW)
        tracker = ValueTracker(0)

        def follow(mob):
            angle = tracker.get_value()
            dot.move_to([-3.5 + radius * np.cos(angle), radius * np.sin(angle), 0])
            pen.move_to([0.5 + angle * 0.45, radius * np.sin(angle), 0])

        dot.add_updater(follow)
        pen.add_updater(follow)
        self.add(circle, wave, dot, pen)
        self.play(tracker.animate.set_value(TAU), run_time=3)
        self.wait(0.3)
勾股定理
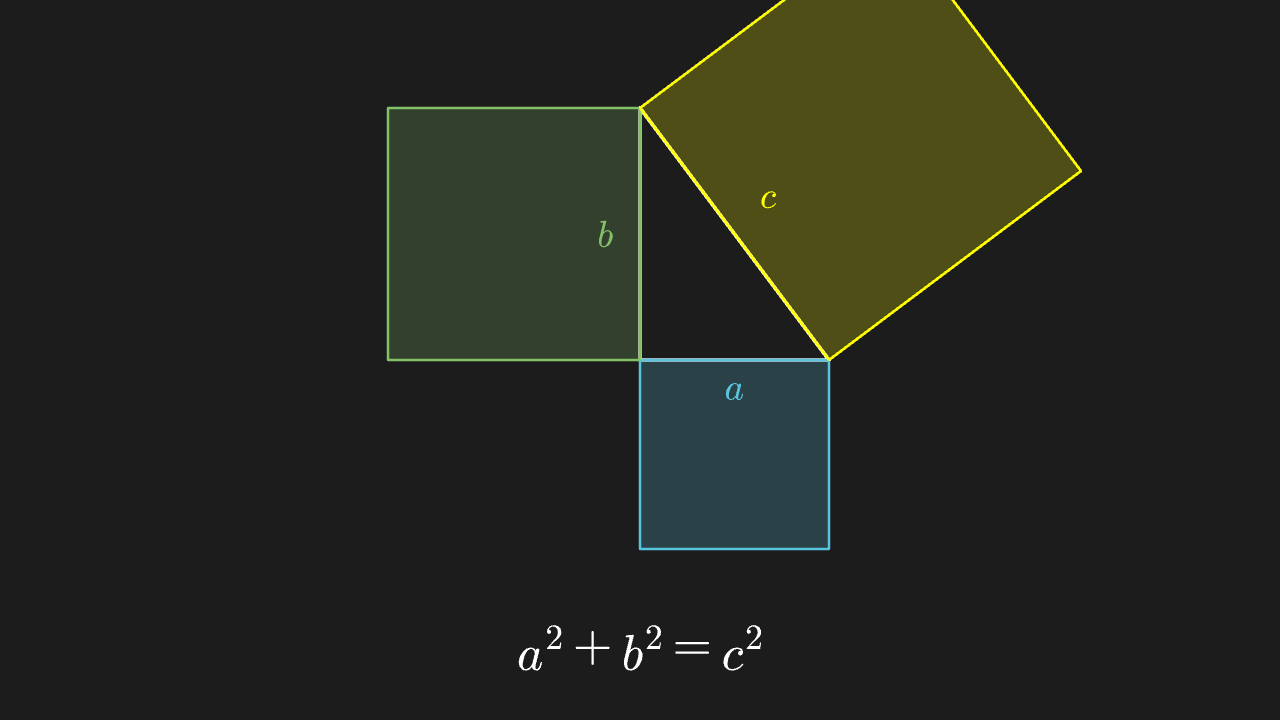
直角三角形三边上贴的正方形面积关系呈现 a² + b² = c²。
"""勾股定理

@expect 直角三角形三边上贴的正方形面积关系呈现 a² + b² = c²。
@note 讲解模板:直角三角形 + 两条直角边上的正方形,公式在下方
"""

from manim import *
import numpy as np


class PythagoreanScene(Scene):
    def construct(self):
        s = 0.7
        A = np.array([0.0, 0.0, 0.0])
        B = A + RIGHT * (3 * s)
        C = A + UP * (4 * s)

        triangle = Polygon(A, B, C, color=WHITE, stroke_width=4)
        a_label = MathTex("a", font_size=40, color=BLUE).move_to((A + B) / 2 + DOWN * 0.35)
        b_label = MathTex("b", font_size=40, color=GREEN).move_to((A + C) / 2 + LEFT * 0.38)
        c_label = MathTex("c", font_size=40, color=YELLOW).move_to((B + C) / 2 + UR * 0.38)

        sq_a = Polygon(A, B, B + DOWN * (3 * s), A + DOWN * (3 * s), color=BLUE, stroke_width=3)
        sq_a.set_fill(BLUE, 0.22)
        sq_b = Polygon(A, C, C + LEFT * (4 * s), A + LEFT * (4 * s), color=GREEN, stroke_width=3)
        sq_b.set_fill(GREEN, 0.22)
        offset = np.array([4 * s, 3 * s, 0.0])
        sq_c = Polygon(B, C, C + offset, B + offset, color=YELLOW, stroke_width=3)
        sq_c.set_fill(YELLOW, 0.22)

        shapes = VGroup(triangle, sq_a, sq_b, sq_c, a_label, b_label, c_label)
        shapes.shift(-shapes.get_center())

        eq = MathTex("a^2", "+", "b^2", "=", "c^2", font_size=54)
        eq.arrange(RIGHT, buff=0.16)
        eq.to_edge(DOWN, buff=0.55)

        self.play(Create(triangle), run_time=1.0)
        self.play(Write(a_label), Write(b_label), Write(c_label), run_time=0.6)
        self.play(Create(sq_a), Create(sq_b), run_time=1.0)
        self.play(Create(sq_c), run_time=1.0)
        self.play(Write(eq), run_time=0.8)
        self.play(Indicate(eq, color=WHITE, scale_factor=1.1), run_time=0.8)
        self.wait(0.5)
极坐标玫瑰线
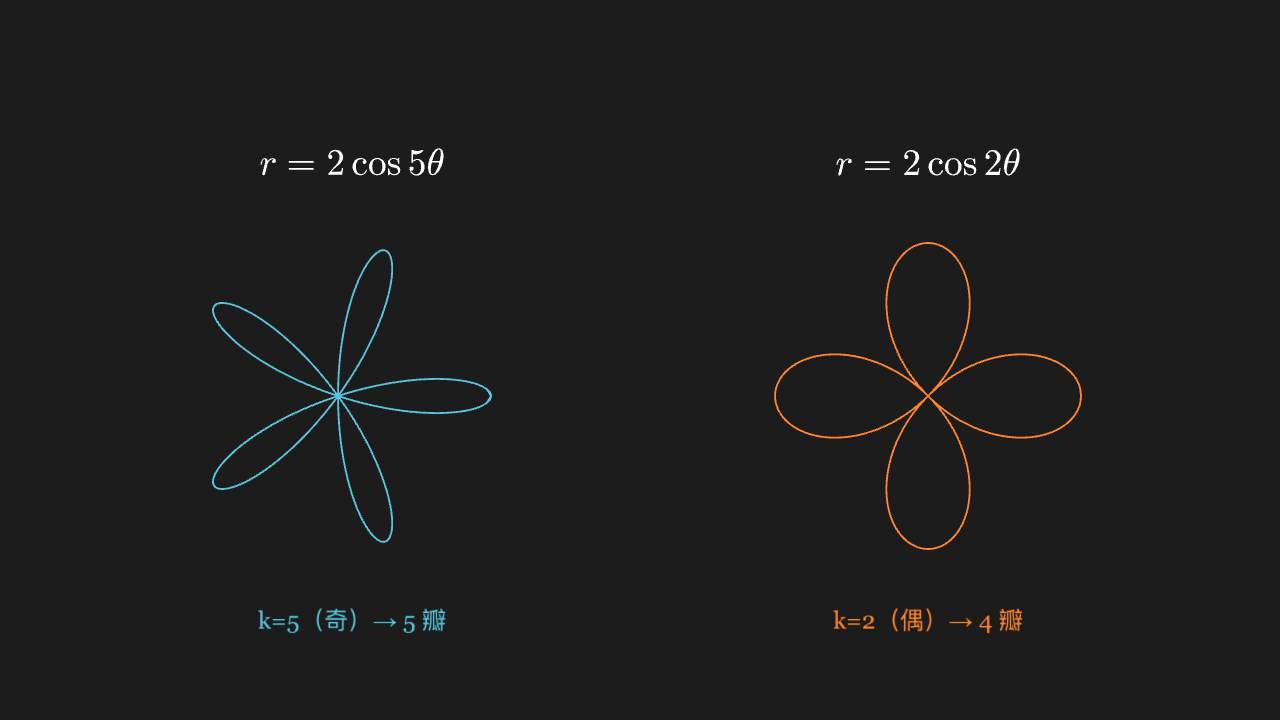
玫瑰线的花瓣数与方程参数一致:左边 k=5 是 5 瓣(k 奇)、右边 k=2 是 4 瓣(2k 瓣,k 偶),两条曲线各自配方程标注,「奇 k → k 瓣 / 偶 k → 2k 瓣」的规律对照着看得出来。
"""极坐标玫瑰线

@expect 玫瑰线的花瓣数与方程参数一致:左边 k=5 是 5 瓣(k 奇)、右边 k=2 是 4 瓣(2k 瓣,k 偶),
两条曲线各自配方程标注,「奇 k → k 瓣 / 偶 k → 2k 瓣」的规律对照着看得出来。
@template 要画极坐标 / 参数方程曲线(玫瑰线、螺线、摆线……manim-web 没有 plot_polar_graph)时照它抄。
@note 讲解模板:manim-web 没有 plot_polar_graph——把 r(θ) 写成参数方程交给 ParametricFunction;
    MathTex 定位只能 move_to 绝对坐标(to_edge 会拿 NaN 包围盒把公式挪出画框)
"""

from manim import *
import numpy as np


class PolarRoseScene(Scene):
    def construct(self):
        def rose(petals, scale):
            def f(t):
                r = scale * np.cos(petals * t)
                return [r * np.cos(t), r * np.sin(t), 0]
            return f

        # 左:k=5(10 瓣);右:k=2(4 瓣)——两组并排对照
        curve_5 = ParametricFunction(rose(5, 1.7), t_range=[0, TAU, 0.02], color=BLUE)
        curve_5.move_to([-3.2, -0.4, 0])
        curve_2 = ParametricFunction(rose(2, 1.7), t_range=[0, TAU, 0.02], color=ORANGE)
        curve_2.move_to([3.2, -0.4, 0])

        title_5 = MathTex(r"r = 2\cos 5\theta", font_size=40).move_to([-3.2, 2.2, 0])
        title_2 = MathTex(r"r = 2\cos 2\theta", font_size=40).move_to([3.2, 2.2, 0])
        note_5 = Text("k=5(奇)→ 5 瓣", font_size=26, color=BLUE).move_to([-3.2, -2.9, 0])
        note_2 = Text("k=2(偶)→ 4 瓣", font_size=26, color=ORANGE).move_to([3.2, -2.9, 0])

        self.play(Write(title_5))
        self.play(Create(curve_5), FadeIn(note_5), run_time=2)
        self.play(Write(title_2))
        self.play(Create(curve_2), FadeIn(note_2), run_time=2)
        self.wait(0.3)
阿基米德螺线
螺线一圈圈等距外扩,圈距恒定(阿基米德螺线的特征)。
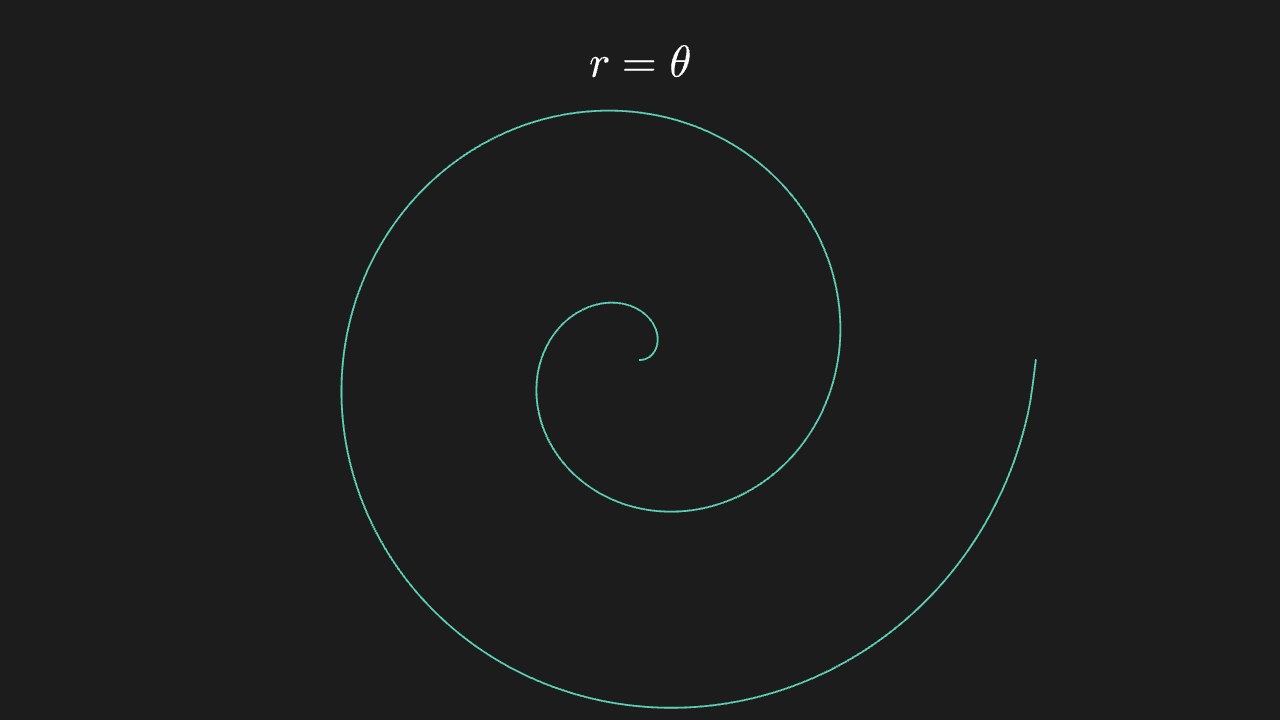
"""阿基米德螺线

@expect 螺线一圈圈等距外扩,圈距恒定(阿基米德螺线的特征)。
@note 讲解模板:r 随 θ 线性增长,同样用参数方程画
"""

from manim import *
import numpy as np


class PolarSpiralScene(Scene):
    def construct(self):
        def spiral(t):
            r = 0.35 * t
            return [r * np.cos(t), r * np.sin(t), 0]

        curve = ParametricFunction(spiral, t_range=[0, TAU * 2, 0.02], color=TEAL)
        title = MathTex(r"r = \theta").to_edge(UP)

        self.play(Write(title))
        self.play(Create(curve), run_time=2)
        self.wait(0.3)
割线趋近切线(导数的定义)
割线绕切点旋转、越来越贴近切线,最终重合。
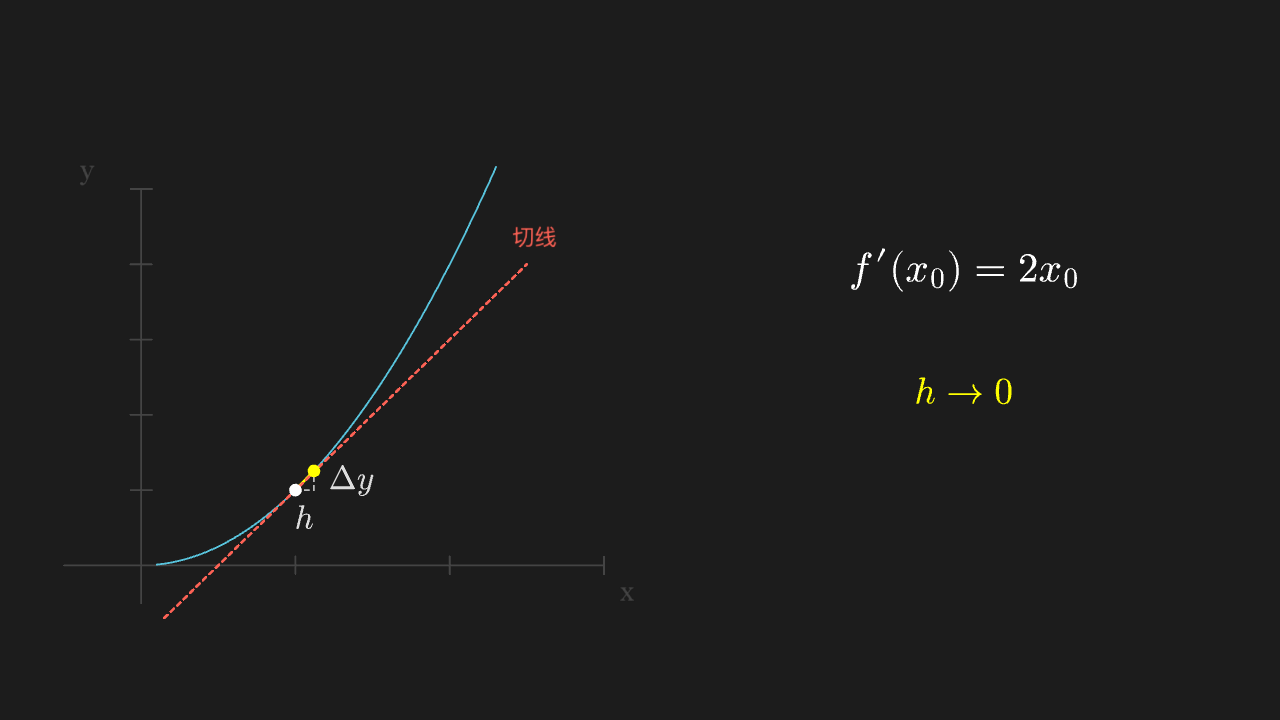
"""割线趋近切线(导数的定义)

@expect 割线绕切点旋转、越来越贴近切线,最终重合。
@template 要讲「极限 / 趋近」——一条线或一个量随参数滑动、逼近目标位置时照它抄。
@note 2026-10-09 真机事故原文:这段被预检误拒两次——`(pos_p() + pos_m()) / 2` 与
      `x0 + h.get_value()` 都拿 c2p / get_value 的返回值做算术,而预检把它们当成了 Mobject
      (`TypeError: unsupported operand type(s) for /: 'Mobject' and 'int'`)。
      修在支持面的 METHOD_RETURNS:预检按真桥的形状返值(坐标→向量、数值→数)。
"""

from manim import *
import numpy as np


class SecantToTangent(Scene):
    def construct(self):
        ax = Axes(
            x_range=[-0.5, 3, 1],
            y_range=[-0.5, 5, 1],
            x_length=6.0,
            y_length=4.6,
            tips=False,
            axis_config={"color": GRAY_D},
        )
        ax.shift(LEFT * 3.4 + DOWN * 0.4)
        # 轴标签手动定位:get_axis_labels 的自动定位会把 "x" 漂到轴外空白处;
        # 适配层 ax.x_axis 是函数不能 get_end,改用 c2p 手算轴末端坐标
        label_x = Text("x", font_size=30, color=GRAY_D).move_to(ax.c2p(3.15, -0.35))
        label_y = Text("y", font_size=30, color=GRAY_D).move_to(ax.c2p(-0.35, 5.25))

        graph = ax.plot(lambda x: x ** 2, x_range=[0.1, 2.3], color=BLUE)

        x0 = 1.0
        h = ValueTracker(1.0)

        def pos_p():
            return ax.c2p(x0, x0 ** 2, 0)

        def pos_q():
            x = x0 + h.get_value()
            return ax.c2p(x, x ** 2, 0)

        def pos_m():
            x = x0 + h.get_value()
            return ax.c2p(x, x0 ** 2, 0)

        # 割线
        secant = Line(pos_p(), pos_q(), color=YELLOW, stroke_width=3)
        secant.add_updater(lambda m: m.put_start_and_end_on(pos_p(), pos_q()))

        # 两点
        dot_p = Dot(pos_p(), color=WHITE, radius=0.07)
        dot_q = Dot(pos_q(), color=YELLOW, radius=0.07)
        dot_q.add_updater(lambda m: m.move_to(pos_q()))

        # 水平 / 竖直增量
        seg_dx = DashedLine(pos_p(), pos_m(), color=GRAY_B, stroke_width=2)
        seg_dx.add_updater(lambda m: m.put_start_and_end_on(pos_p(), pos_m()))
        seg_dy = DashedLine(pos_m(), pos_q(), color=GRAY_B, stroke_width=2)
        seg_dy.add_updater(lambda m: m.put_start_and_end_on(pos_m(), pos_q()))

        dx_label = MathTex("h", font_size=36, color=GRAY_A)
        dx_label.add_updater(lambda m: m.move_to((pos_p() + pos_m()) / 2 + DOWN * 0.3))
        dy_label = MathTex(r"\Delta y", font_size=36, color=GRAY_A)
        dy_label.add_updater(lambda m: m.move_to((pos_m() + pos_q()) / 2 + RIGHT * 0.42))

        # 差商公式
        eq = MathTex(r"\frac{f(x_0+h)-f(x_0)}{h}", font_size=44)
        eq.move_to([3.6, 1.0, 0])
        result = MathTex(r"f'(x_0)=2x_0", font_size=44)
        result.move_to([3.6, 1.0, 0])
        caption = MathTex(r"h\to 0", font_size=40, color=YELLOW).next_to(eq, DOWN, buff=0.7)

        # 切线
        tangent = DashedLine(
            ax.c2p(0.15, 2 * 0.15 - 1, 0),
            ax.c2p(2.5, 2 * 2.5 - 1, 0),
            color=RED,
            stroke_width=3,
        )

        self.play(Create(ax), Write(label_x), Write(label_y), run_time=1.0)
        self.play(Create(graph), run_time=1.0)
        self.play(FadeIn(dot_p), FadeIn(dot_q), run_time=0.5)
        self.play(Create(secant), run_time=0.7)
        self.play(Create(seg_dx), Create(seg_dy), Write(dx_label), Write(dy_label), run_time=0.8)
        self.play(Write(eq), run_time=0.8)
        self.play(Write(caption), run_time=0.4)

        # h 变小,割线滑向切线
        self.play(h.animate.set_value(0.12), run_time=3.0, rate_func=smooth)
        self.play(FadeIn(tangent), run_time=0.7)
        tangent_label = Text("切线", font_size=24, color=RED).move_to(ax.c2p(2.55, 4.35))
        self.play(Write(tangent_label), run_time=0.5)
        self.play(FadeTransform(eq, result), run_time=1.0)
        self.play(Indicate(result, color=YELLOW, scale_factor=1.15), run_time=0.8)
        self.wait(0.8)
黎曼和逼近积分
矩形越分越细、矩形面积之和越来越接近定积分值:粗分 dx=1 的矩形以描边 ghost 留在终态与细分 dx=0.25 对照,右侧两行标注给出两档的面积和(1.60 → 2.63,真值 2.27)。
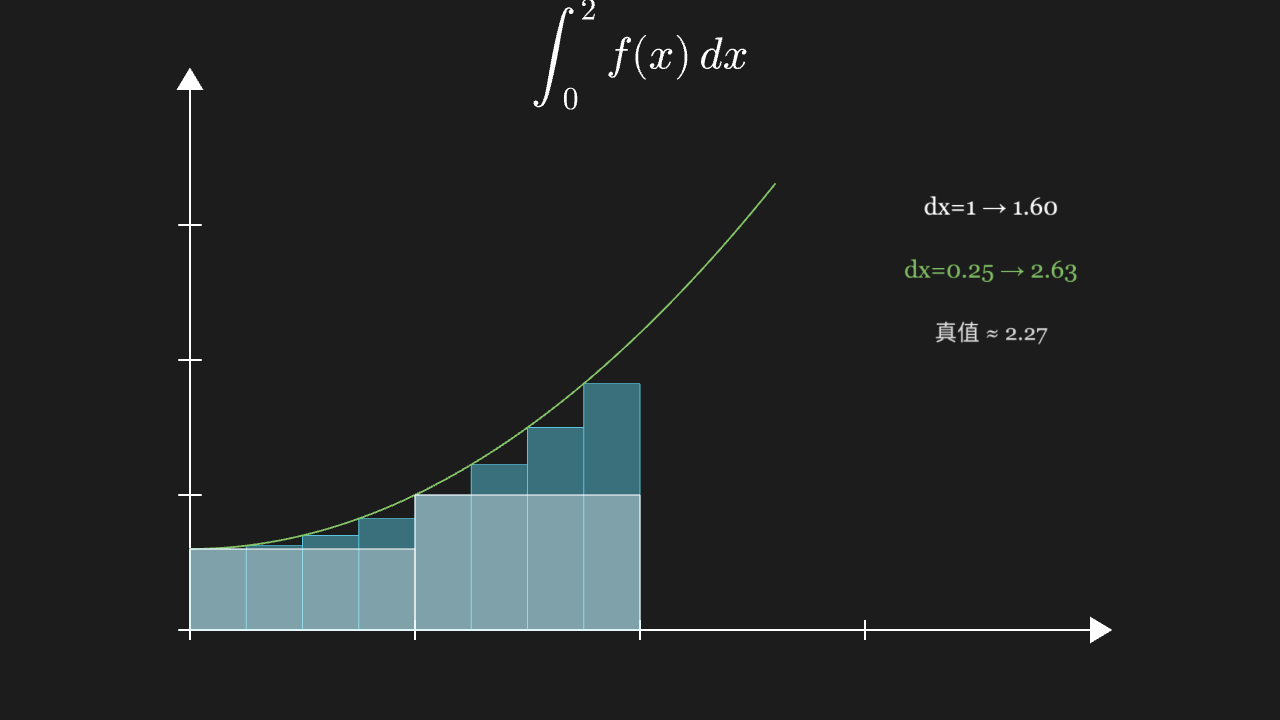
"""黎曼和逼近积分

@expect 矩形越分越细、矩形面积之和越来越接近定积分值:粗分 dx=1 的矩形以描边 ghost 留在终态
        与细分 dx=0.25 对照,右侧两行标注给出两档的面积和(1.60 → 2.63,真值 2.27)。
@template 要讲「细分 / 求和逼近」(黎曼和、梯形近似、级数部分和这类越分越准的画面)时照它抄。
@note 讲解模板:同一段区间把 dx 变小,矩形和逼近曲线下的面积;
    粗分矩形在 Transform 前 copy 存档,变换后以低透明度描边 add 回去,才有「从什么变到什么」的对照
"""

from manim import *


class RiemannSumScene(Scene):
    def construct(self):
        ax = Axes(x_range=[0, 4, 1], y_range=[0, 4, 1])
        # 曲线只画到 x=2.6:0.4*2.6²+0.6≈3.3,峰落在 y_range=[0,4] 内不被上缘裁断
        graph = ax.plot(lambda x: 0.4 * x * x + 0.6, x_range=[0, 2.6], color=GREEN)
        coarse = ax.get_riemann_rectangles(graph, x_range=[0, 2], dx=1)
        fine = ax.get_riemann_rectangles(graph, x_range=[0, 2], dx=0.25)
        formula = MathTex(r"\int_0^2 f(x)\,dx").move_to([0, 3.4, 0])

        # 粗分存档:Transform 前抄一份,终态以低透明度描边留在原位对照
        coarse_ghost = coarse.copy().set_fill(opacity=0).set_stroke(WHITE, width=1.5, opacity=0.7)

        note_coarse = Text("dx=1 → 1.60", font_size=26, color=WHITE).move_to([3.9, 1.7, 0])
        note_fine = Text("dx=0.25 → 2.63", font_size=26, color=GREEN).move_to([3.9, 1.0, 0])
        note_true = Text("真值 ≈ 2.27", font_size=24, color=GRAY_A).move_to([3.9, 0.3, 0])

        self.play(Create(ax), Create(graph))
        self.play(Write(formula), FadeIn(coarse))
        self.play(Transform(coarse, fine))
        self.add(coarse_ghost)
        self.play(Write(note_coarse), Write(note_fine), Write(note_true), run_time=0.8)
        self.wait(0.3)
线性变换:旋转
网格与向量整体旋转 30°(非 90° 倍数,网格斜过来朝向明显变了),形状不变;矩阵写成 cos/sin 30° 的形式,绿色箭头长 2 格、旋转后仍对齐网格刻度。
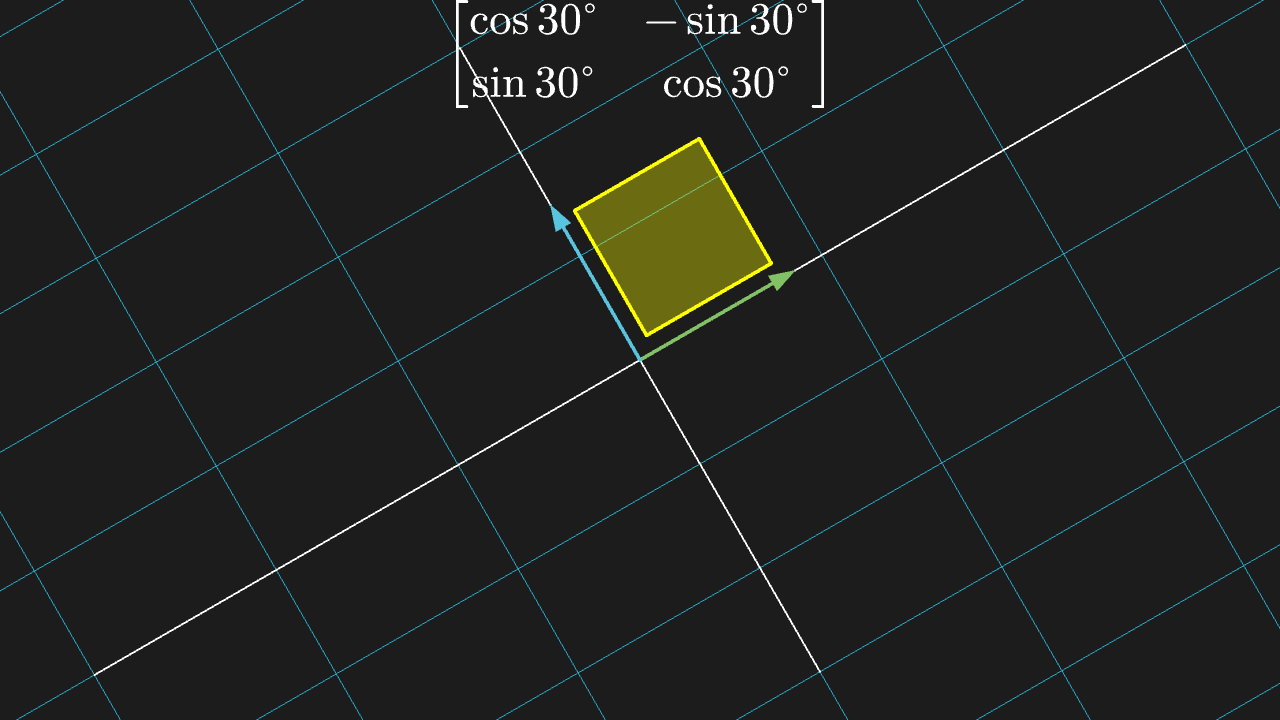
"""线性变换:旋转

@expect 网格与向量整体旋转 30°(非 90° 倍数,网格斜过来朝向明显变了),形状不变;
        矩阵写成 cos/sin 30° 的形式,绿色箭头长 2 格、旋转后仍对齐网格刻度。
@note 讲解模板:ApplyMatrix 把基向量与图形一起按矩阵搬过去;
    旋转角避开 90° 的倍数——90° 时网格与原来重合,看不出转没转
"""

from manim import *
import math


class RotationTransformScene(Scene):
    def construct(self):
        c, s = math.cos(math.radians(30)), math.sin(math.radians(30))
        # 网格与向量一起参与变换,让「整体旋转」看得见
        plane = NumberPlane(
            x_range=[-3, 3, 1],
            y_range=[-3, 3, 1],
            background_line_style={"stroke_color": BLUE_D, "stroke_width": 1.5},
            axis_config={"stroke_color": GRAY_D},
        )
        basis = VGroup(
            Arrow(start=ORIGIN, end=RIGHT * 2, color=GREEN),
            Arrow(start=ORIGIN, end=UP * 2, color=BLUE),
        )
        square = Square(side_length=1.6, color=YELLOW)
        square.set_fill(YELLOW, 0.35)
        square.move_to(RIGHT + UP)
        figure = VGroup(plane, basis, square)
        title = MathTex(
            r"\begin{bmatrix} \cos 30^\circ & -\sin 30^\circ \\ \sin 30^\circ & \cos 30^\circ \end{bmatrix}"
        ).move_to([0, 3.4, 0])

        self.play(Create(figure), Write(title))
        self.play(ApplyMatrix([[c, -s], [s, c]], figure), run_time=2)
        self.wait(0.3)
线性变换:剪切
网格被剪切:横行水平错动、竖列倾斜,变换前网格以低透明度 ghost 留在原位对照,一个 1×1 参照正方形变成同底同高的平行四边形——「每格面积不变(det=1)」看得见。
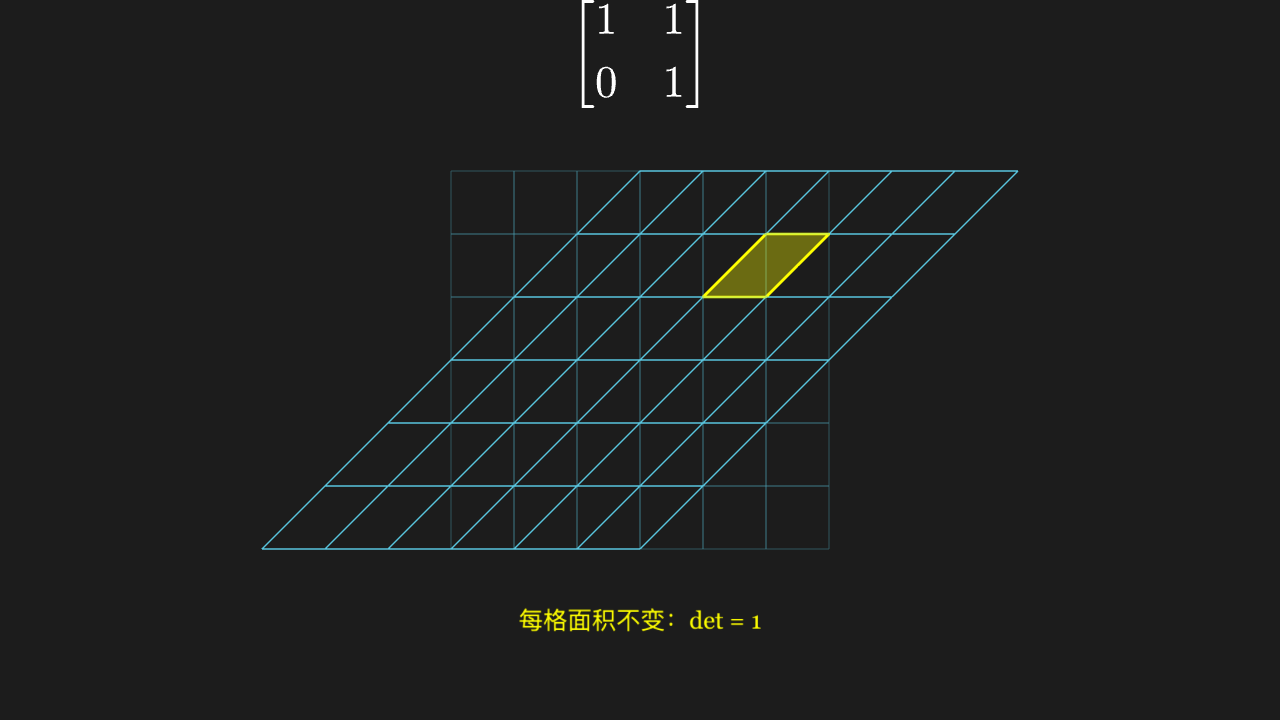
"""线性变换:剪切

@expect 网格被剪切:横行水平错动、竖列倾斜,变换前网格以低透明度 ghost 留在原位对照,
        一个 1×1 参照正方形变成同底同高的平行四边形——「每格面积不变(det=1)」看得见。
@note 讲解模板:剪切矩阵把竖直方向推向水平方向,网格最能看出来;
    ghost(copy 低透明度、不参与 ApplyMatrix)给出「原来是什么」的对照
"""

from manim import *


class ShearTransformScene(Scene):
    def construct(self):
        cells = VGroup()
        for i in range(-3, 3):
            for j in range(-3, 3):
                cell = Square(side_length=0.7, color=BLUE, stroke_width=1.5)
                cell.move_to([i * 0.7 + 0.35, j * 0.7 + 0.35, 0])
                cells.add(cell)

        # 变换前 ghost:低透明度网格留原位,不参与变换
        ghost = cells.copy().set_stroke(GREY, width=1, opacity=0.35)

        # 1×1 参照正方形:剪切后底和高都不变,只是被推歪
        unit = Square(side_length=0.7, color=YELLOW, stroke_width=3).set_fill(YELLOW, 0.35)
        unit.move_to([-0.35 + 0.7, 0.35 + 0.7, 0])

        title = MathTex(r"\begin{bmatrix} 1 & 1 \\ 0 & 1 \end{bmatrix}").move_to([0, 3.4, 0])
        note = Text("每格面积不变:det = 1", font_size=26, color=YELLOW).move_to([0, -2.9, 0])

        self.play(Create(ghost), Create(cells), Write(title))
        self.play(FadeIn(unit), run_time=0.5)
        self.play(ApplyMatrix([[1, 1], [0, 1]], VGroup(cells, unit)), run_time=2)
        self.play(Write(note), run_time=0.5)
        self.wait(0.3)
线性变换:特征方向
特征方向上的向量变换后仍在这条方向上(红 v₁ 沿虚线拉长 3 倍、蓝 v₂ 不动),灰色对照向量 u 变换后偏离原方向——偏折的与不偏折的对照着看;虚线即两条特征方向。变换前三根向量以半透明 ghost 留原位,箭头尖附近有 λ₁=3 / λ₂=1 标注。
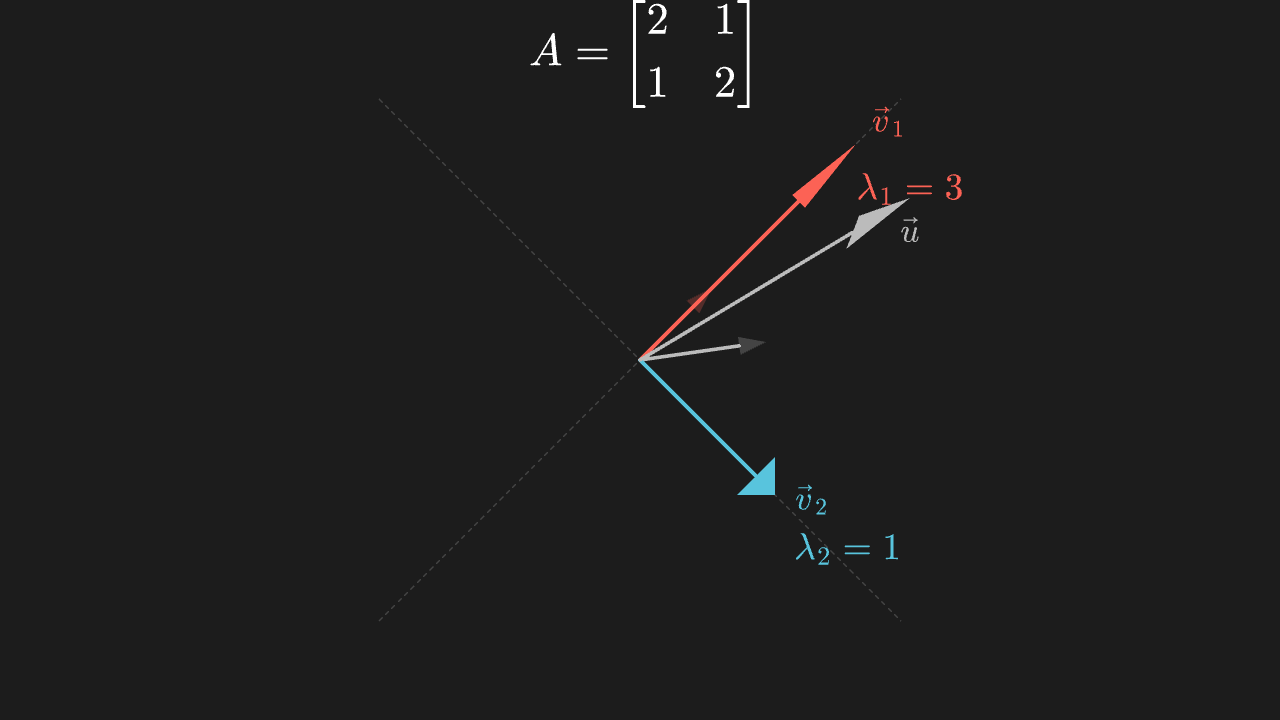
"""线性变换:特征方向

@expect 特征方向上的向量变换后仍在这条方向上(红 v₁ 沿虚线拉长 3 倍、蓝 v₂ 不动),
灰色对照向量 u 变换后偏离原方向——偏折的与不偏折的对照着看;虚线即两条特征方向。
变换前三根向量以半透明 ghost 留原位,箭头尖附近有 λ₁=3 / λ₂=1 标注。
@template 要讲线性变换 / 矩阵作用于图形与向量(网格变形、变换前后对照、找不变方向)时照它抄。
@note 讲解模板:变换后方向不变的向量就是特征向量(A 的特征值 3 与 1,特征方向 [1,1] 与 [1,-1])
"""

from manim import *
import numpy as np


class EigenvectorScene(Scene):
    def construct(self):
        A = np.array([[2.0, 1.0], [1.0, 2.0]])

        # 两条特征方向虚线([1,1] 与 [1,-1])
        dash_e1 = DashedLine([-2.9, -2.9, 0], [2.9, 2.9, 0], color=GRAY_D, stroke_width=1.5)
        dash_e2 = DashedLine([-2.9, 2.9, 0], [2.9, -2.9, 0], color=GRAY_D, stroke_width=1.5)

        # 特征向量缩短初始长度,拉长 3 倍后仍不出框
        vec_a = Arrow(start=ORIGIN, end=[0.8, 0.8, 0], color=RED, buff=0)
        vec_b = Arrow(start=ORIGIN, end=[1.5, -1.5, 0], color=BLUE, buff=0)
        # 非特征对照向量,变换后明显偏折([1,1] 方向的 v₁ 不偏,对照才醒目)
        vec_c = Arrow(start=ORIGIN, end=[1.4, 0.2, 0], color=GRAY_B, buff=0)

        t = ValueTracker(0)

        def tip(v):
            """从初始端点插值到 A·v 的端点,供标签跟随(不用 MathTex 包围盒定位)"""
            v = np.asarray(v, dtype=float)
            w = A @ v[:2]
            return (1 - t.get_value()) * v + t.get_value() * np.array([w[0], w[1], 0.0])

        label_a = MathTex(r"\vec v_1", color=RED, font_size=36)
        label_a.add_updater(lambda m: m.move_to(tip([0.8, 0.8, 0]) + UP * 0.25 + RIGHT * 0.35))
        label_b = MathTex(r"\vec v_2", color=BLUE, font_size=36)
        label_b.add_updater(lambda m: m.move_to(tip([1.5, -1.5, 0]) + DOWN * 0.05 + RIGHT * 0.4))
        label_c = MathTex(r"\vec u", color=GRAY_B, font_size=36)
        label_c.add_updater(lambda m: m.move_to(tip([1.4, 0.2, 0]) + DOWN * 0.35))

        title = MathTex(r"A = \begin{bmatrix} 2 & 1 \\ 1 & 2 \end{bmatrix}").move_to([0, 3.4, 0])

        self.play(FadeIn(dash_e1), FadeIn(dash_e2))
        self.play(Create(vec_a), Create(vec_b), Create(vec_c), Write(title))
        self.play(Write(label_a), Write(label_b), Write(label_c), run_time=0.6)

        # 变换前 ghost:三根向量以低透明度留原位(不参与变换),供 before/after 对照
        ghosts = VGroup(vec_a.copy(), vec_b.copy(), vec_c.copy()).set_opacity(0.25)
        self.play(FadeIn(ghosts), run_time=0.5)

        self.play(
            ApplyMatrix([[2, 1], [1, 2]], VGroup(vec_a, vec_b, vec_c)),
            t.animate.set_value(1),
            run_time=2,
        )
        # 特征值标注:单个 MathTex 直接 move_to 到对应箭头尖附近
        lam_1 = MathTex(r"\lambda_1=3", color=RED, font_size=40).move_to([3.0, 1.9, 0])
        lam_2 = MathTex(r"\lambda_2=1", color=BLUE, font_size=40).move_to([2.3, -2.1, 0])
        self.play(Write(lam_1), Write(lam_2), run_time=0.7)
        self.wait(0.3)
概率:投骰子的频率
掷骰子次数越多,六面的频率柱越来越齐平(趋近均匀):六根柱几乎等高(15%–18%),实测值都贴着理论值 16.7% 的橙色虚线附近起伏。
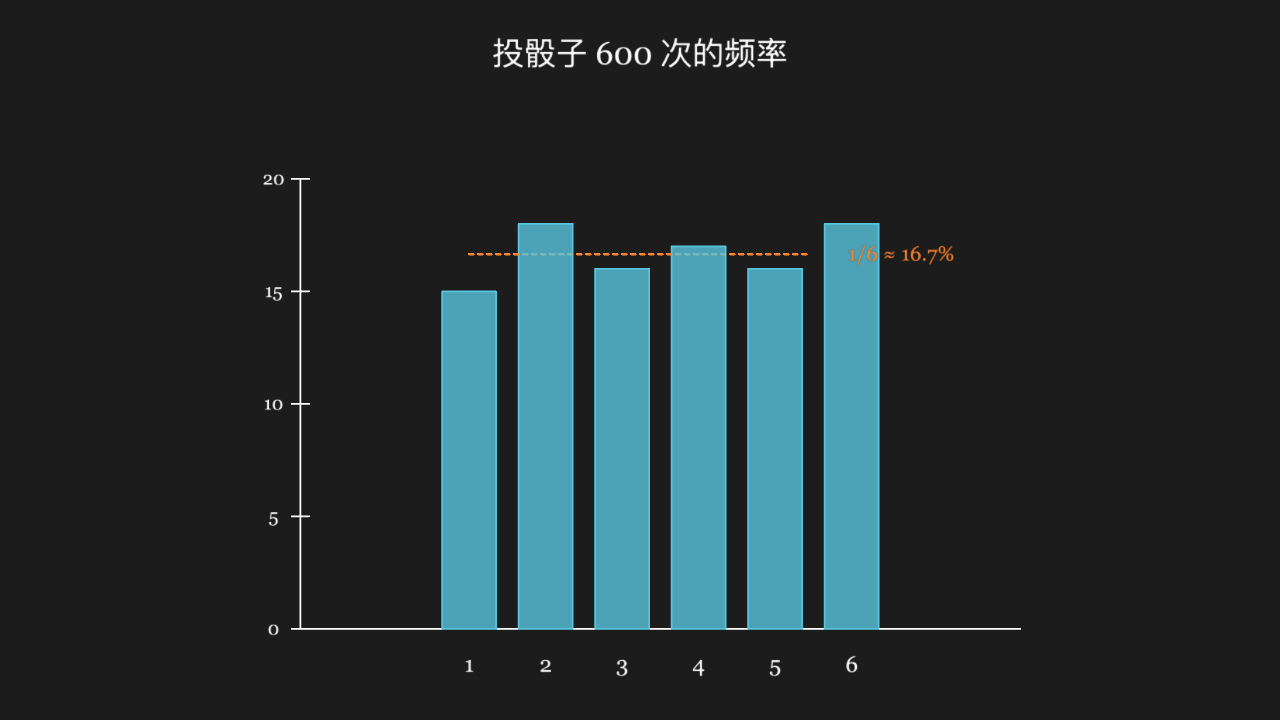
"""概率:投骰子的频率

@expect 掷骰子次数越多,六面的频率柱越来越齐平(趋近均匀):六根柱几乎等高(15%–18%),
实测值都贴着理论值 16.7% 的橙色虚线附近起伏。
@template 要画「随机模拟 + 频率柱状图 + 理论值对照线」(大数定律、蒙特卡洛这类实验对照理论)时照它抄。
@note 讲解模板:BarChart 画实测频率,与理论值 1/6 对照;BarChart 默认摆位偏右上、
      上缘刻度会被裁,需整体 move_to 居中偏下并收紧 y_range;刻度用整数百分比
      (适配层把两位小数刻度标签四舍五入到一位,0.05 步进会显示成重复的 0.2/0.1);
      BarChart 实例不挂 c2p(只有 Axes 桥接),参考线按图表几何手算绝对坐标
"""

from manim import *


class DiceFrequencyScene(Scene):
    def construct(self):
        observed_pct = [15, 18, 16, 17, 16, 18]
        chart = BarChart(
            values=observed_pct,
            y_range=[0, 20, 5],
            bar_colors=[BLUE],
        )
        chart.move_to([0, -0.7, 0])
        title = Text("投骰子 600 次的频率", font_size=34).move_to([0, 3.4, 0])

        # 理论值 1/6=16.7% 的参考线:量程 20 对应轴高 5 单位(默认 y_length),
        # 16.7% 高度 = 16.7/20*5 ≈ 4.2;轴底经实测标定在 y≈-3.0
        guide = DashedLine(
            [-1.9, -3.0 + 16.7 / 20 * 5, 0],
            [1.9, -3.0 + 16.7 / 20 * 5, 0],
            color=ORANGE,
            stroke_width=2.5,
        )
        guide_label = Text("1/6 ≈ 16.7%", font_size=22, color=ORANGE)
        guide_label.move_to([2.9, -3.0 + 16.7 / 20 * 5, 0])

        self.play(Write(title))
        self.play(Create(chart))
        self.play(Create(guide), Write(guide_label))
        self.wait(0.3)
概率:二项分布
两组二项分布 pmf 折线并排:n=10 峰值约 0.25、n=30 峰值约 0.14——同样的 p,n 越大分布越矮越宽,「参数决定胖瘦」靠两组对照成立。
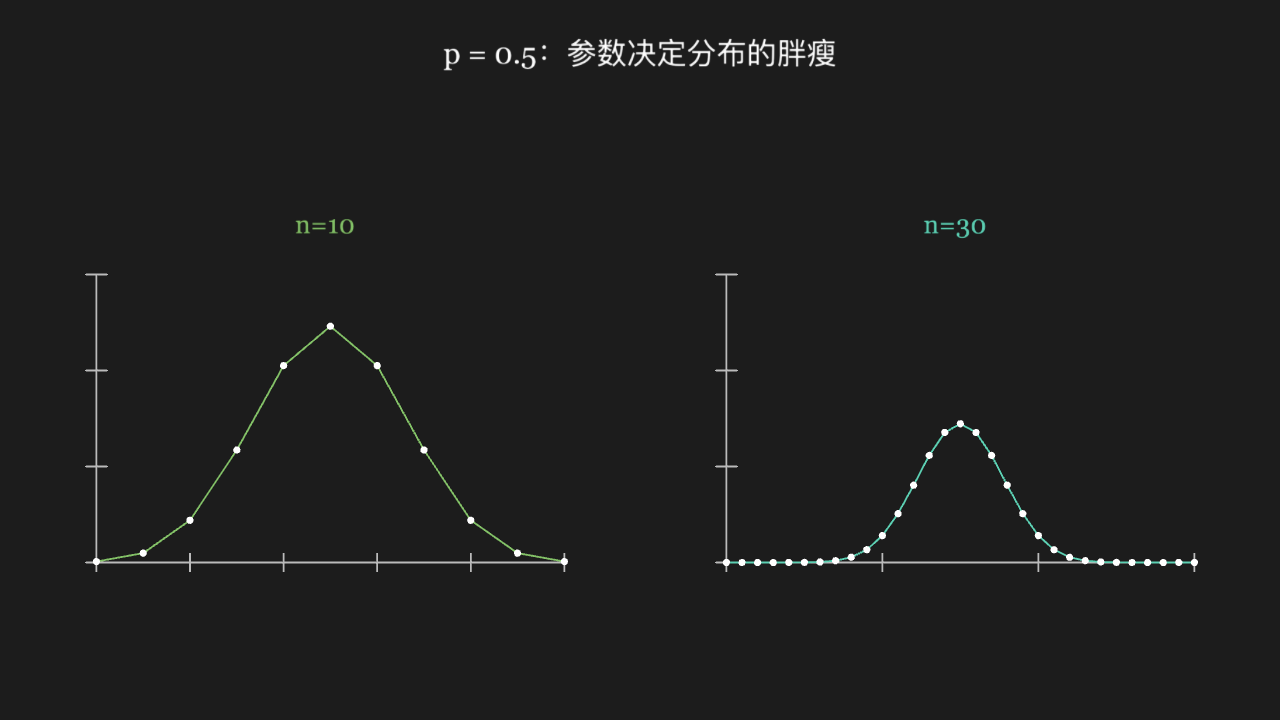
"""概率:二项分布

@expect 两组二项分布 pmf 折线并排:n=10 峰值约 0.25、n=30 峰值约 0.14——
        同样的 p,n 越大分布越矮越宽,「参数决定胖瘦」靠两组对照成立。
@note 讲解模板:n 次试验成功 k 次的概率——p 相同、n 不同,两组折线对照着看;
      BarChart 默认摆位偏右上且宽度不受 x_length 约束、两组会重叠出框,
      降级用 Axes.plot_line_graph 左右各占半幅;
      "p = 0.5" 里的 p 斜体字形易缺字,标题一律用 Text 不用 MathTex
"""

from manim import *
import math


class BinomialScene(Scene):
    def construct(self):
        ks_10 = list(range(11))
        pmf_10 = [math.comb(10, k) * 0.5 ** 10 for k in ks_10]
        ks_30 = list(range(31))
        pmf_30 = [math.comb(30, k) * 0.5 ** 30 for k in ks_30]

        ax_10 = Axes(
            x_range=[0, 10, 2],
            y_range=[0, 0.3, 0.1],
            x_length=5.2,
            y_length=3.2,
            tips=False,
            axis_config={"color": GRAY_B},
        )
        ax_10.move_to([-3.5, -0.7, 0])
        graph_10 = ax_10.plot_line_graph(ks_10, pmf_10, add_vertex_dots=True,
                                         line_color=GREEN, vertex_dot_radius=0.04)

        ax_30 = Axes(
            x_range=[0, 30, 10],
            y_range=[0, 0.3, 0.1],
            x_length=5.2,
            y_length=3.2,
            tips=False,
            axis_config={"color": GRAY_B},
        )
        ax_30.move_to([3.5, -0.7, 0])
        graph_30 = ax_30.plot_line_graph(ks_30, pmf_30, add_vertex_dots=True,
                                         line_color=TEAL, vertex_dot_radius=0.04)

        label_10 = Text("n=10", font_size=28, color=GREEN).move_to([-3.5, 1.5, 0])
        label_30 = Text("n=30", font_size=28, color=TEAL).move_to([3.5, 1.5, 0])
        title = Text("p = 0.5:参数决定分布的胖瘦", font_size=32).move_to([0, 3.4, 0])

        self.play(Write(title))
        self.play(Create(ax_10), Create(graph_10), Write(label_10), run_time=1.2)
        self.play(Create(ax_30), Create(graph_30), Write(label_30), run_time=1.2)
        self.wait(0.3)
空间直角坐标系与立方体
斜视看一个棱长 2 的立方体:三个面同时可见、明暗各不同(有光有深度,不是一块黑);它坐在第一象限,最远的顶点 (2, 2, 2) 上有个黄点、旁边跟着黄色标注;三条坐标轴从原点穿出,Z 轴朝上。标题钉在画面左上角、不跟相机跑。相机先绕方位角自转一段,再动画转到另一侧——终帧看到的是立方体的另一组侧面,与初始斜视完全不同,证明相机真动了,不是被 2D 拍扁的一张脸。
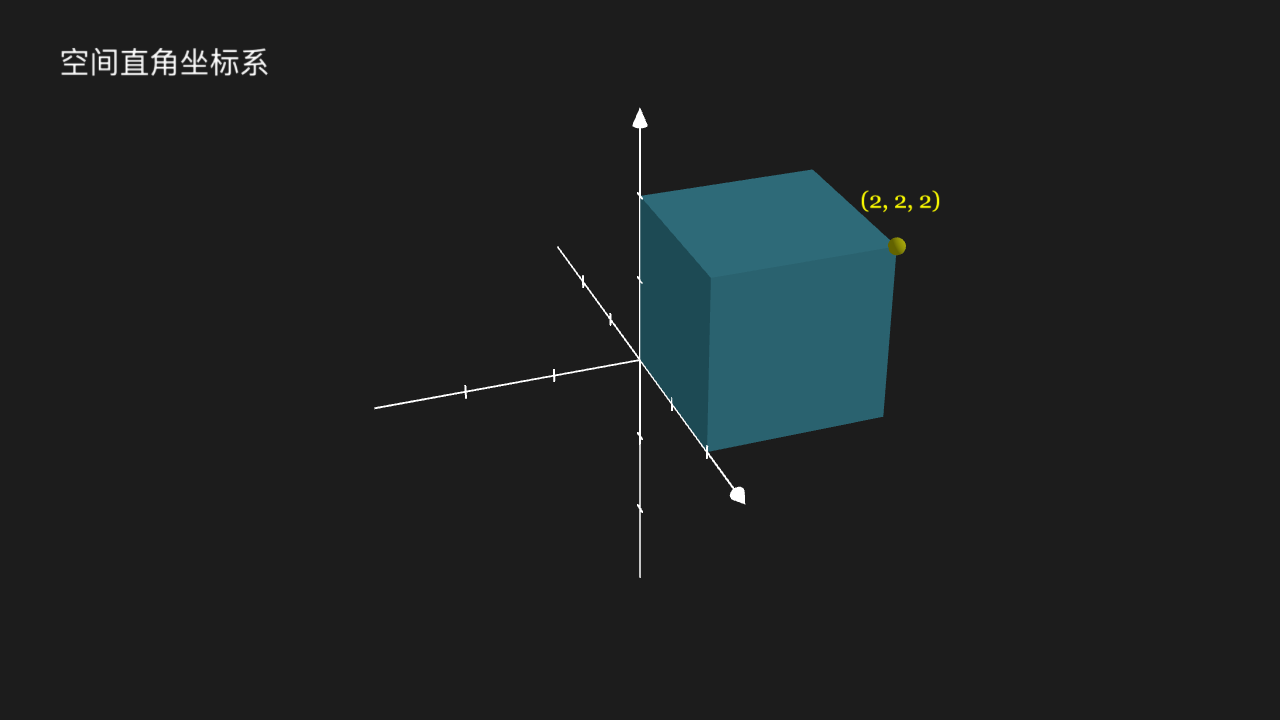
"""空间直角坐标系与立方体

@expect 斜视看一个棱长 2 的立方体:三个面同时可见、明暗各不同(有光有深度,不是一块黑);
        它坐在第一象限,最远的顶点 (2, 2, 2) 上有个黄点、旁边跟着黄色标注;
        三条坐标轴从原点穿出,Z 轴朝上。标题钉在画面左上角、不跟相机跑。
        相机先绕方位角自转一段,再动画转到另一侧——终帧看到的是立方体的另一组侧面,
        与初始斜视完全不同,证明相机真动了,不是被 2D 拍扁的一张脸。
@template 要画 3D 空间图形(立方体 / 球 / 多面体 / 坐标轴)或想让相机转起来时照它抄。
@note 3D 物体**必须**写 class X(ThreeDScene):普通的 Scene 里一盏灯都没有,
      吃光的材质落进去就是一团纯黑(不是「3D 没实现」,是放错场景了)。
      屏幕上的字用 add_fixed_in_frame_mobjects 钉住;3D 里跟着物体走、又要一直正对镜头的字
      用 add_fixed_orientation_mobjects——斜视下它俩都不会被压扁。
      3D 实体的颜色 / 透明用构造参数 color / opacity(CE 的 fill_color / fill_opacity 在 3D 实体上不生效)。
"""

from manim import *

SIDE = 2.0


class SpaceCubeScene(ThreeDScene):
    def construct(self):
        # 轴比默认短一圈(默认 x∈[-6,6]、z∈[-4,4],斜视下会顶到画面边):
        # 立方体已经占住画面中心,轴只用来交代「这是个坐标系」。
        axes = ThreeDAxes(x_range=[-3, 3, 1], y_range=[-3, 3, 1], z_range=[-3, 3, 1])
        cube = Cube(side_length=SIDE, color=BLUE)
        cube.shift([SIDE / 2, SIDE / 2, SIDE / 2])  # 坐进第一象限,别跟坐标轴原点叠在一起
        corner = Dot3D(point=[SIDE, SIDE, SIDE], radius=0.09, color=YELLOW)

        title = Text("空间直角坐标系", font_size=32)
        title.to_corner(UL)
        self.add_fixed_in_frame_mobjects(title)  # 钉在屏幕上:不跟相机转,也不会被斜视压扁

        corner_label = Text("(2, 2, 2)", font_size=22, color=YELLOW)
        corner_label.move_to([SIDE, SIDE, SIDE + 0.5])
        self.add_fixed_orientation_mobjects(corner_label)  # 留在 3D 里,但永远正对镜头

        self.set_camera_orientation(phi=70 * DEGREES, theta=-135 * DEGREES)  # 初始斜视
        self.play(Create(axes), FadeIn(cube), FadeIn(corner), Write(title), run_time=1)
        self.begin_ambient_camera_rotation(rate=0.4)  # 相机自己绕方位角慢慢转
        self.wait(1.5)
        self.stop_ambient_camera_rotation()
        self.move_camera(phi=60 * DEGREES, theta=-20 * DEGREES, run_time=2)  # 再动画转到另一侧
        self.wait(0.2)